Albertsons 2013 Annual Report Download - page 26
Download and view the complete annual report
Please find page 26 of the 2013 Albertsons annual report below. You can navigate through the pages in the report by either clicking on the pages listed below, or by using the keyword search tool below to find specific information within the annual report.-
 1
1 -
2
-
3
-
4
-
5
-
6
-
7
-
8
-
9
-
10
-
11
-
12
-
13
-
14
-
15
-
 16
16 -
 17
17 -
 18
18 -
 19
19 -
 20
20 -
 21
21 -
 22
22 -
 23
23 -
 24
24 -
 25
25 -
 26
26 -
 27
27 -
 28
28 -
 29
29 -
 30
30 -
 31
31 -
 32
32 -
 33
33 -
 34
34 -
 35
35 -
 36
36 -
37
-
38
-
39
-
40
-
41
-
42
-
43
-
44
-
45
-
46
-
47
-
48
-
49
-
50
-
51
-
52
-
53
-
54
-
55
-
56
-
57
-
58
-
59
-
60
-
61
-
62
-
63
-
64
-
65
-
66
-
67
-
68
-
69
-
70
-
71
-
72
-
73
-
74
-
75
-
76
-
77
-
78
-
79
-
80
-
81
-
82
-
83
-
84
-
85
-
86
-
87
-
88
-
89
-
90
-
91
-
92
-
93
-
94
-
95
-
96
-
97
-
98
-
99
-
100
-
101
-
102
-
103
-
104
-
105
-
106
-
107
-
108
-
109
-
110
-
111
-
112
-
113
-
114
-
115
-
116
-
117
-
118
-
119
-
120
-
121
-
122
-
123
-
124
-
125
-
126
-
127
-
128
-
129
-
130
-
131
-
132
 |
 |

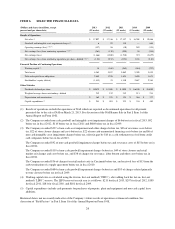
ITEM 6. SELECTED FINANCIAL DATA
(Dollars and shares in millions, except
percent and per share data)
2013
(52 weeks)
2012
(52 weeks)
2011
(52 weeks)
2010
(53 weeks)
2009
(52 weeks)
Results of Operations
Net sales (1) $ 17,097 $ 17,336 $ 17,357 $ 18,208 $ 19,886
Goodwill and intangible asset impairment charges (2) 6 92 110 — 684
Operating earnings (loss) (1)(2)(3) (157) 96 (30) 289 (351)
Net earnings (loss) from continuing operations (1)(2)(3) (263) (110) (200) 50 (594)
Net earnings (loss) (1,466) (1,040) (1,510) 393 (2,855)
Net earnings (loss) from continuing operations per share—diluted (1)(2)(3) (1.24) (0.52) (0.94) 0.24 (2.82)
Financial Position of Continuing Operations
Working capital (4) 38 (169) (269) (461) (237)
Total assets 4,563 5,057 5,062 5,390 5,855
Debt and capital lease obligations 2,889 3,226 3,654 3,620 3,673
Stockholders’ equity (deficit) (1,415) 21 1,340 2,887 2,581
Other Statistics
Dividends declared per share $ 0.0875 $ 0.3500 $ 0.3500 $ 0.6100 $ 0.6900
Weighted average shares outstanding—diluted 212 212 212 213 211
Depreciation and amortization $ 365 $ 355 $ 354 $ 368 $ 377
Capital expenditures (5) $ 241 $ 403 $ 323 $ 338 $ 489
(1) Results of operations exclude the operations of NAI, which are reported as discontinued operations for all periods
presented due to the sale of NAI on March 21, 2013. See discussion of the NAI Banner Sale in Part I, Item 1 of this
Annual Report on Form 10-K.
(2) The Company recorded non-cash goodwill and intangible asset impairment charges of $6 before tax in fiscal 2013, $92
before tax in fiscal 2012, $110 before tax in fiscal 2011 and $684 before tax in fiscal 2009.
(3) The Company recorded $227 of non-cash asset impairment and other charges before tax, $36 of severance costs before
tax, $22 of store closure charges and costs before tax, $22 of non-cash unamortized financing costs before tax and $6 of
non-cash intangible asset impairment charges before tax, offset in part by $10 in a cash settlement received from credit
card companies before tax in fiscal 2013.
The Company recorded $92 of non-cash goodwill impairment charges before tax and severance costs of $15 before tax in
fiscal 2012.
The Company recorded $110 of non-cash goodwill impairment charges before tax, $49 of store closures and retail
market exit charges and costs before tax, and $38 of charges for severance, labor buyout and other costs before tax in
fiscal 2011.
The Company recorded $36 of charges for retail market exits in Cincinnati before tax, and received fees of $13 from the
early termination of a supply agreement before tax in fiscal 2010.
The Company recorded $684 of non-cash goodwill impairment charges before tax and $53 of charges related primarily
to store closures before tax in fiscal 2009.
(4) Working capital ratio is calculated using the first-in, first-out method (“FIFO”), after adding back the last-in, first-out
method (“LIFO”) reserve. The LIFO reserve for each year is as follows: $211 for fiscal 2013, $207 for fiscal 2012, $185
for fiscal 2011, $181 for fiscal 2010, and $181 for fiscal 2009.
(5) Capital expenditures include cash payments for purchases of property, plant and equipment and non-cash capital lease
additions.
Historical data is not necessarily indicative of the Company’s future results of operations or financial condition. See
discussion of “Risk Factors” in Part I, Item 1A of this Annual Report on Form 10-K.
24