Albertsons 2013 Annual Report Download - page 62
Download and view the complete annual report
Please find page 62 of the 2013 Albertsons annual report below. You can navigate through the pages in the report by either clicking on the pages listed below, or by using the keyword search tool below to find specific information within the annual report.-
 1
1 -
2
-
3
-
4
-
5
-
6
-
7
-
8
-
9
-
10
-
11
-
12
-
13
-
14
-
15
-
16
-
17
-
18
-
19
-
20
-
21
-
22
-
23
-
24
-
25
-
26
-
27
-
28
-
29
-
30
-
31
-
32
-
33
-
34
-
35
-
36
-
37
-
38
-
39
-
40
-
41
-
42
-
43
-
44
-
45
-
46
-
47
-
48
-
49
-
50
-
51
-
 52
52 -
 53
53 -
 54
54 -
 55
55 -
 56
56 -
 57
57 -
 58
58 -
 59
59 -
 60
60 -
 61
61 -
 62
62 -
 63
63 -
 64
64 -
 65
65 -
 66
66 -
 67
67 -
 68
68 -
 69
69 -
 70
70 -
 71
71 -
 72
72 -
73
-
74
-
75
-
76
-
77
-
78
-
79
-
80
-
81
-
82
-
83
-
84
-
85
-
86
-
87
-
88
-
89
-
90
-
91
-
92
-
93
-
94
-
95
-
96
-
97
-
98
-
99
-
100
-
101
-
102
-
103
-
104
-
105
-
106
-
107
-
108
-
109
-
110
-
111
-
112
-
113
-
114
-
115
-
116
-
117
-
118
-
119
-
120
-
121
-
122
-
123
-
124
-
125
-
126
-
127
-
128
-
129
-
130
-
131
-
132
 |
 |
statements, historical collection experience, aging of receivables and other economic and industry factors. It is
possible that the accuracy of the estimation process could be materially impacted by different judgments,
estimations and assumptions based on the information considered and result in a further deterioration of accounts
and notes receivable. The allowance for losses on receivables was $5 and $3 at February 23, 2013 and
February 25, 2012, respectively. Bad debt expense was $11, $6 and $11 in fiscal 2013, 2012 and 2011,
respectively.
Inventories, Net
Inventories are valued at the lower of cost or market. Substantially all of the Company’s inventory consists of
finished goods.
The Company uses one of either replacement cost, weighted average cost, or the retail inventory method (“RIM”)
to value discrete inventory items at lower of cost or market before application of any last-in, first-out (“LIFO”)
reserve. As of February 23, 2013 and February 25, 2012, approximately 60 percent of the Company’s inventories
were valued under the LIFO method.
As of February 23, 2013 and February 25, 2012, approximately 5 percent and 4 percent, respectively, of the
Company’s inventories were valued under the replacement cost method before application of any LIFO reserve.
The weighted average cost and RIM methods of inventory valuation together comprised approximately
55 percent and 56 percent of inventory as of February 23, 2013 and February 25, 2012, respectively, before
application of any LIFO reserve.
Under the replacement cost method applied on a LIFO basis, the most recent purchase cost is used to calculate
the current cost of inventory before application of any LIFO reserve. The replacement cost approach results in
inventories being valued at the lower of cost or market because of the high inventory turnover and the resulting
low inventory days supply on hand combined with infrequent vendor price changes for these items of inventory.
The Company uses one of either cost, weighted average cost, RIM or replacement cost to value certain discrete
inventory items under the first-in, first-out method (“FIFO”). The replacement cost approach under the FIFO
method is predominantly utilized in determining the value of high turnover perishable items, including Produce,
Deli, Bakery, Meat and Floral.
As of February 23, 2013 and February 25, 2012, approximately 23 percent and 22 percent, respectively, of the
Company’s inventories were valued using the cost, weighted average cost and RIM methods under the FIFO
method of inventory accounting. The remaining 17 percent and 18 percent of the Company’s inventories as of
February 23, 2013 and February 25, 2012, respectively, were valued using the replacement cost approach under
the FIFO method of inventory accounting. The replacement cost approach applied under the FIFO method results
in inventories recorded at the lower of cost or market because of the very high inventory turnover and the
resulting low inventory days supply for these items of inventory.
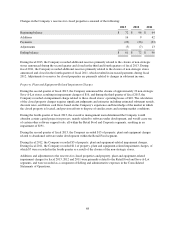
During fiscal 2013, 2012 and 2011, inventory quantities in certain LIFO layers were reduced. These reductions
resulted in a liquidation of LIFO inventory quantities carried at lower costs prevailing in prior years as compared
with the cost of fiscal 2013, 2012 and 2011 purchases. As a result, Cost of sales decreased by $6, $9 and $5 in
fiscal 2013, 2012 and 2011, respectively. If the FIFO method had been used to determine cost of inventories for
which the LIFO method is used, the Company’s inventories would have been higher by approximately $211 and
$207 as of February 23, 2013 and February 25, 2012, respectively.
The Company evaluates inventory shortages throughout each fiscal year based on actual physical counts in its
facilities. Allowances for inventory shortages are recorded based on the results of these counts to provide for
estimated shortages as of the end of each fiscal year.
60