Albertsons 2013 Annual Report Download - page 71
Download and view the complete annual report
Please find page 71 of the 2013 Albertsons annual report below. You can navigate through the pages in the report by either clicking on the pages listed below, or by using the keyword search tool below to find specific information within the annual report.-
 1
1 -
2
-
3
-
4
-
5
-
6
-
7
-
8
-
9
-
10
-
11
-
12
-
13
-
14
-
15
-
16
-
17
-
18
-
19
-
20
-
21
-
22
-
23
-
24
-
25
-
26
-
27
-
28
-
29
-
30
-
31
-
32
-
33
-
34
-
35
-
36
-
37
-
38
-
39
-
40
-
41
-
42
-
43
-
44
-
45
-
46
-
47
-
48
-
49
-
50
-
51
-
52
-
53
-
54
-
55
-
56
-
57
-
58
-
59
-
60
-
 61
61 -
 62
62 -
 63
63 -
 64
64 -
 65
65 -
 66
66 -
 67
67 -
 68
68 -
 69
69 -
 70
70 -
 71
71 -
 72
72 -
 73
73 -
 74
74 -
 75
75 -
 76
76 -
 77
77 -
 78
78 -
 79
79 -
 80
80 -
 81
81 -
82
-
83
-
84
-
85
-
86
-
87
-
88
-
89
-
90
-
91
-
92
-
93
-
94
-
95
-
96
-
97
-
98
-
99
-
100
-
101
-
102
-
103
-
104
-
105
-
106
-
107
-
108
-
109
-
110
-
111
-
112
-
113
-
114
-
115
-
116
-
117
-
118
-
119
-
120
-
121
-
122
-
123
-
124
-
125
-
126
-
127
-
128
-
129
-
130
-
131
-
132
 |
 |
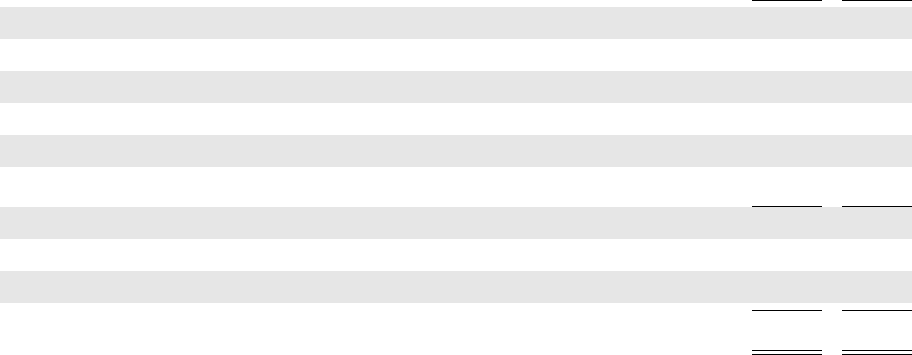
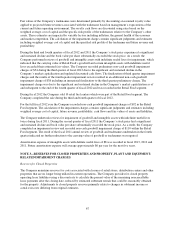
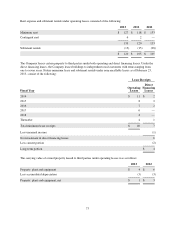
NOTE 4—PROPERTY, PLANT AND EQUIPMENT
Property, plant and equipment, net, consisted of the following:
2013 2012
Land $ 100 $ 103
Buildings 1,294 1,240
Property under construction 37 297
Leasehold improvements 688 652
Equipment 2,733 2,701
Capitalized lease assets 335 369
Total property plant and equipment 5,187 5,362
Accumulated depreciation (3,277) (3,063)
Accumulated amortization on capitalized lease assets (210) (200)
Total property, plant and equipment, net $ 1,700 $ 2,099
Depreciation expense was $333, $321 and $320 for fiscal 2013, 2012 and 2011, respectively. Amortization
expense related to capitalized lease assets was $23, $26 and $26 for fiscal 2013, 2012 and 2011, respectively.
NOTE 5—FAIR VALUE MEASUREMENTS
Fair value is defined as the price that would be received to sell an asset or paid to transfer a liability in an orderly
transaction between market participants at the measurement date. Assets and liabilities recorded at fair value are
categorized using defined hierarchical levels directly related to the amount of subjectivity associated with the
inputs to fair value measurements, as follows:
Level 1 - Quoted prices in active markets for identical assets or liabilities;
Level 2 - Inputs other than quoted prices included within Level 1 that are either directly or indirectly
observable;
Level 3 - Unobservable inputs in which little or no market activity exists, requiring an entity to develop
its own assumptions that market participants would use to value the asset or liability.
Impairment charges recorded during fiscal 2013, 2012 and 2011 discussed in Note 2—Goodwill and Intangible
Assets and Note 3—Reserves for Closed Properties and Property, Plant and Equipment-Related Impairment
Charges were measured at fair value using Level 3 inputs. The fair value of performance awards discussed in
Note 9—Stock-Based Awards are measured at fair value on a recurring basis each reporting period using Level 3
inputs. The portion of the performance awards that are measured at fair value each reporting period as discussed
in Note 1 and Note 9 are insignificant as of February 23, 2013 and February 25, 2012.
In fiscal 2013, long-lived assets with a carrying amount of $79 were written down to their fair value of $40,
resulting in an impairment charge of $39, primarily related to the announced closing of approximately 22 non-
strategic Save-A-Lot stores. In fiscal 2012, long-lived assets with a carrying amount of $10 were written down to
their fair value of $7, resulting in an impairment charge of $3. Property, plant and equipment and favorable
operating lease intangible related impairment charges were measured at fair value on a nonrecurring basis using
Level 3 inputs and are a component of Selling and administrative expenses in the Consolidated Statements of
Operations.
69