Albertsons 2013 Annual Report Download - page 86
Download and view the complete annual report
Please find page 86 of the 2013 Albertsons annual report below. You can navigate through the pages in the report by either clicking on the pages listed below, or by using the keyword search tool below to find specific information within the annual report.-
 1
1 -
2
-
3
-
4
-
5
-
6
-
7
-
8
-
9
-
10
-
11
-
12
-
13
-
14
-
15
-
16
-
17
-
18
-
19
-
20
-
21
-
22
-
23
-
24
-
25
-
26
-
27
-
28
-
29
-
30
-
31
-
32
-
33
-
34
-
35
-
36
-
37
-
38
-
39
-
40
-
41
-
42
-
43
-
44
-
45
-
46
-
47
-
48
-
49
-
50
-
51
-
52
-
53
-
54
-
55
-
56
-
57
-
58
-
59
-
60
-
61
-
62
-
63
-
64
-
65
-
66
-
67
-
68
-
69
-
70
-
71
-
72
-
73
-
74
-
75
-
 76
76 -
 77
77 -
 78
78 -
 79
79 -
 80
80 -
 81
81 -
 82
82 -
 83
83 -
 84
84 -
 85
85 -
 86
86 -
 87
87 -
 88
88 -
 89
89 -
 90
90 -
 91
91 -
 92
92 -
 93
93 -
 94
94 -
 95
95 -
 96
96 -
97
-
98
-
99
-
100
-
101
-
102
-
103
-
104
-
105
-
106
-
107
-
108
-
109
-
110
-
111
-
112
-
113
-
114
-
115
-
116
-
117
-
118
-
119
-
120
-
121
-
122
-
123
-
124
-
125
-
126
-
127
-
128
-
129
-
130
-
131
-
132
 |
 |

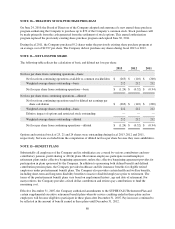
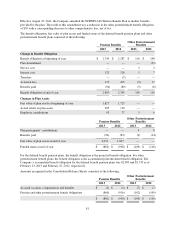
For those retirees whose health plans provide for variable employer contributions, the assumed healthcare cost
trend rate used in measuring the accumulated postretirement benefit obligation before and after age 65 was
7.50 percent, as of February 23, 2013. The assumed healthcare cost trend rate for retirees before and after age 65
will decrease by 0.25 percent for each of the next four years, through fiscal 2017, 0.50 percent in fiscal 2018, and
1.0 percent in fiscal 2019, until it reaches the ultimate trend rate of 5.0 percent. For those retirees whose health
plans provide for a fixed employer contribution rate, a healthcare cost trend is not applicable. The healthcare cost
trend rate assumption would have the following impact on the amounts reported. A 100 basis point change in the
trend rate would impact the Company’s service and interest cost by approximately $1 for fiscal 2013. A 100 basis
point decrease in the trend rate would impact the Company’s accumulated postretirement benefit obligation as of
the end of fiscal 2013 by approximately $7, while a 100 basis point increase would impact the Company’s
accumulated postretirement benefit obligation by approximately $10.
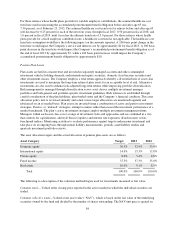
Pension Plan Assets
Plan assets are held in a master trust and invested in separately managed accounts and other commingled
investment vehicles holding domestic and international equity securities, domestic fixed income securities and
other investment classes. The Company employs a total return approach whereby a diversified mix of asset class
investments are used to maximize the long-term return of plan assets for an acceptable level of risk. Alternative
investments are also used to enhance risk-adjusted long-term returns while improving portfolio diversification.
Risk management is managed through diversification across asset classes, multiple investment manager
portfolios and both general and portfolio-specific investment guidelines. Risk tolerance is established through
careful consideration of the plan liabilities, plan funded status and the Company’s financial condition. This asset
allocation policy mix is reviewed annually and actual versus target allocations are monitored regularly and
rebalanced on an as-needed basis. Plan assets are invested using a combination of active and passive investment
strategies. Passive, or “indexed” strategies, attempt to mimic rather than exceed the investment performance of a
market benchmark. The plan’s active investment strategies employ multiple investment management firms.
Managers within each asset class cover a range of investment styles and approaches and are combined in a way
that controls for capitalization, and style biases (equities) and interest rate exposures (fixed income) versus
benchmark indices. Monitoring activities to evaluate performance against targets and measure investment risk
take place on an ongoing basis through annual liability measurements, periodic asset/liability studies and
quarterly investment portfolio reviews.
The asset allocation targets and the actual allocation of pension plan assets are as follows:
Asset Category Target 2013 2012
Domestic equity 30.5% 32.9% 33.9%
International equity 14.0% 15.3% 17.8%
Private equity 8.0% 5.4% 4.8%
Fixed income 37.5% 37.3% 35.0%
Real estate 10.0% 9.1% 8.5%
Total 100.0% 100.0% 100.0%
The following is a description of the valuation methodologies used for investments measured at fair value:
Common stock— Valued at the closing price reported in the active market in which the individual securities are
traded.
Common collective trusts—Valued at net asset value (“NAV”), which is based on the fair value of the underlying
securities owned by the fund and divided by the number of shares outstanding. The NAV unit price is quoted on
84