Albertsons 2013 Annual Report Download - page 72
Download and view the complete annual report
Please find page 72 of the 2013 Albertsons annual report below. You can navigate through the pages in the report by either clicking on the pages listed below, or by using the keyword search tool below to find specific information within the annual report.-
 1
1 -
2
-
3
-
4
-
5
-
6
-
7
-
8
-
9
-
10
-
11
-
12
-
13
-
14
-
15
-
16
-
17
-
18
-
19
-
20
-
21
-
22
-
23
-
24
-
25
-
26
-
27
-
28
-
29
-
30
-
31
-
32
-
33
-
34
-
35
-
36
-
37
-
38
-
39
-
40
-
41
-
42
-
43
-
44
-
45
-
46
-
47
-
48
-
49
-
50
-
51
-
52
-
53
-
54
-
55
-
56
-
57
-
58
-
59
-
60
-
61
-
 62
62 -
 63
63 -
 64
64 -
 65
65 -
 66
66 -
 67
67 -
 68
68 -
 69
69 -
 70
70 -
 71
71 -
 72
72 -
 73
73 -
 74
74 -
 75
75 -
 76
76 -
 77
77 -
 78
78 -
 79
79 -
 80
80 -
 81
81 -
 82
82 -
83
-
84
-
85
-
86
-
87
-
88
-
89
-
90
-
91
-
92
-
93
-
94
-
95
-
96
-
97
-
98
-
99
-
100
-
101
-
102
-
103
-
104
-
105
-
106
-
107
-
108
-
109
-
110
-
111
-
112
-
113
-
114
-
115
-
116
-
117
-
118
-
119
-
120
-
121
-
122
-
123
-
124
-
125
-
126
-
127
-
128
-
129
-
130
-
131
-
132
 |
 |
Financial Instruments
For certain of the Company’s financial instruments, including cash and cash equivalents, receivables, accounts
payable, accrued salaries and other current assets and liabilities, the fair values approximate carrying values due
to their short maturities.
The estimated fair value of notes receivable was greater than the carrying value by $2 as of February 23, 2013.
The estimated fair value of notes receivable approximated the carrying value as of February 25, 2012. The
estimated fair value of notes receivable are calculated using a discounted cash flow approach applying a market
rate for similar instruments using Level 3 inputs.
The estimated fair value of the Company’s long-term debt (including current maturities) was greater than the
book value by approximately $57 and $62 as of February 23, 2013 and February 25, 2012, respectively. The
estimated fair value was based on market quotes, where available, or market values for similar instruments, using
Level 2 and 3 inputs.
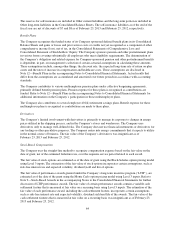
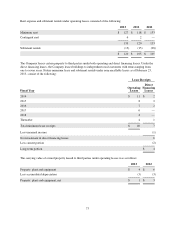
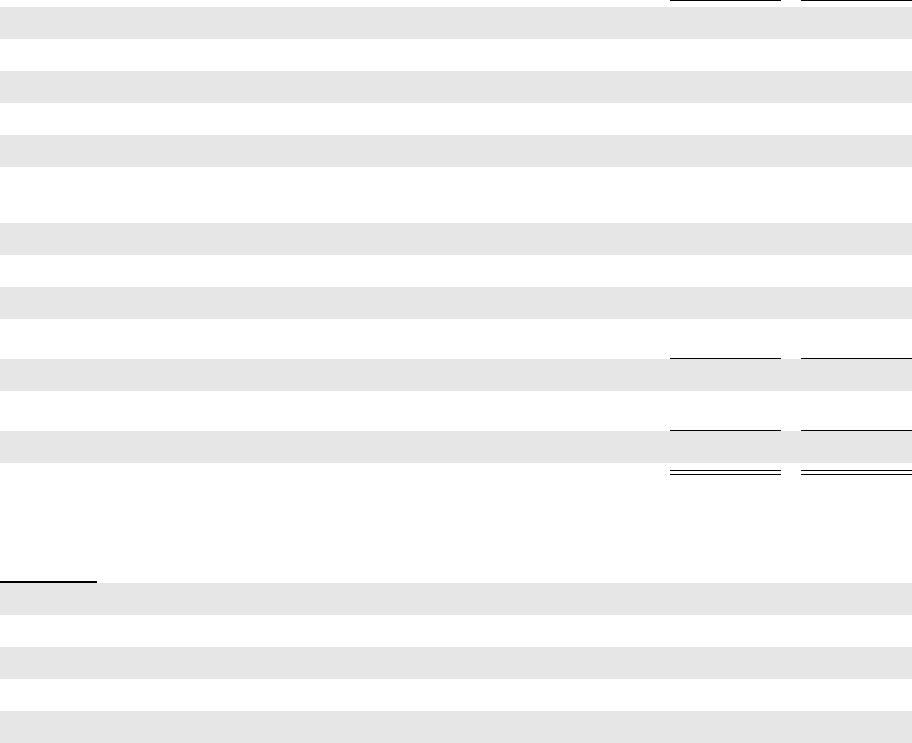
NOTE 6—LONG-TERM DEBT
The Company’s long-term debt and capital lease obligations consisted of the following:
February 23,
2013
February 25,
2012
8.00% Notes due May 2016 $ 1,000 $ 1,000
8.00% Secured Term Loan Facility due August 2018 834 —
7.50% Notes due November 2014 490 490
2.21% to 4.25% Revolving ABL Credit Facility due August 2017 207 —
Accounts Receivable Securitization Facility 40 55
1.65% to 4.75% Revolving Credit Facility and Variable Rate Notes due April
2015—April 2018 — 1,074
7.50% Notes due May 2012 — 282
Other 28 30
Net discount on debt, using an effective interest rate of 8.39% to 8.58% (40) (20)
Capital lease obligations 330 315
Total debt and capital lease obligations 2,889 3,226
Less current maturities of long-term debt and capital lease obligations (74) (345)
Long-term debt and capital lease obligations $ 2,815 $ 2,881
Future maturities of long-term debt, excluding the net discount on the debt and capital lease obligations, as of
February 23, 2013 consist of the following:
Fiscal Year
2014 $19
2015 556
2016 9
2017 1,008
2018 216
Thereafter 791
70