Albertsons 2013 Annual Report Download - page 29
Download and view the complete annual report
Please find page 29 of the 2013 Albertsons annual report below. You can navigate through the pages in the report by either clicking on the pages listed below, or by using the keyword search tool below to find specific information within the annual report.-
 1
1 -
2
-
3
-
4
-
5
-
6
-
7
-
8
-
9
-
10
-
11
-
12
-
13
-
14
-
15
-
16
-
17
-
18
-
 19
19 -
 20
20 -
 21
21 -
 22
22 -
 23
23 -
 24
24 -
 25
25 -
 26
26 -
 27
27 -
 28
28 -
 29
29 -
 30
30 -
 31
31 -
 32
32 -
 33
33 -
 34
34 -
 35
35 -
 36
36 -
 37
37 -
 38
38 -
 39
39 -
40
-
41
-
42
-
43
-
44
-
45
-
46
-
47
-
48
-
49
-
50
-
51
-
52
-
53
-
54
-
55
-
56
-
57
-
58
-
59
-
60
-
61
-
62
-
63
-
64
-
65
-
66
-
67
-
68
-
69
-
70
-
71
-
72
-
73
-
74
-
75
-
76
-
77
-
78
-
79
-
80
-
81
-
82
-
83
-
84
-
85
-
86
-
87
-
88
-
89
-
90
-
91
-
92
-
93
-
94
-
95
-
96
-
97
-
98
-
99
-
100
-
101
-
102
-
103
-
104
-
105
-
106
-
107
-
108
-
109
-
110
-
111
-
112
-
113
-
114
-
115
-
116
-
117
-
118
-
119
-
120
-
121
-
122
-
123
-
124
-
125
-
126
-
127
-
128
-
129
-
130
-
131
-
132
 |
 |
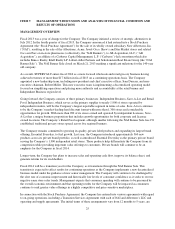
Consolidated results for fiscal 2013 include net charges of $303 before tax ($187 after tax, or $0.88 per diluted
share), comprised of non-cash property, plant and equipment impairment charges of $227 before tax ($140 after
tax, or $0.66 per diluted share), employee-related expenses, primarily severance and labor buyout costs of $36
before tax ($23 after tax, or $0.10 per diluted share), store closure costs of $22 before tax ($13 after tax, or $0.06
per diluted share), write-off of unamortized financing costs of $22 before tax ($14 after tax, or $0.07 per diluted
share) and intangible asset impairment charges of $6 before tax ($3 after tax, or $0.02 per diluted share) which
were partially offset by a cash settlement received from credit card companies of $10 before tax ($6 after tax, or
$0.03 per diluted share).
During fiscal 2013, the Company added 69 new stores through new store development, and closed 70 stores,
including planned dispositions, all of which were Save-A-Lot stores. Total retail square footage as of the end of
fiscal 2013 was approximately 17.4 million, a decrease of approximately 0.9 percent from the end of fiscal 2012.
Total retail square footage, excluding actual and planned store dispositions, decreased 0.9 percent from the end
of fiscal 2012.
Net Sales
Net sales for fiscal 2013 were $17,097, compared with $17,336 last year. Retail Food net sales were 27.7 percent
of Net sales, Save-A-Lot net sales were 24.5 percent of Net sales for fiscal 2013 and Independent Business net
sales were 47.8 percent of Net sales, compared with 28.4 percent, 24.3 percent and 47.3 percent, respectively, last
year.
Retail Food net sales for fiscal 2013 were $4,736, compared with $4,921 last year, a decrease of $185, or 3.8
percent. The decrease is primarily due to negative identical store sales of 2.4 percent or $117 (defined as stores
operating for four full quarters, including store expansions and excluding planned store dispositions) and impacts
from decreased fuel sales due to the divestiture of ten fuel centers and planned store dispositions. Retail Food
negative identical store sales performance was primarily a result of continued price-focused competitive activity
and the challenging economic environment. During fiscal 2013, customer counts declined approximately 1.9
percent while average basket size decreased approximately 0.5 percent driven by moderate levels of inflation and
fewer items per customer.
Save-A-Lot net sales for fiscal 2013 were $4,195, compared with $4,221 last year, a decrease of $26, or 0.6
percent. The decrease is primarily due to $120 related to negative network identical store sales of 3.3 percent
(defined as net sales from Company-owned stores and sales to licensee stores operating for four full quarters,
including store expansions and excluding planned store dispositions) and $111 due to store dispositions, partially
offset by an increase of $205 in sales due to new store openings.
Independent Business net sales for fiscal 2013 were $8,166, compared with $8,194 last year, a decrease of $28 or
0.3 percent. The decrease is primarily due to lower like sales to existing customers offset in part by increased
sales from net new business.
Gross Profit
Gross profit for fiscal 2013 was $2,294, compared with $2,410 last year, a decrease of $116 or 4.8 percent. The
decrease in Gross profit dollars is primarily due to a $39 decline in the Company’s sales volume and declines in
gross margin rates within certain of the Company’s business segments. Gross profit, as a percent of Net sales,
was 13.4 percent for fiscal 2013 compared with 13.9 percent last year.
Retail Food gross profit as a percent of Retail Food Net sales was 26.7 percent for fiscal 2013 compared with
26.3 percent last year. The 40 basis point increase in Retail Food gross profit rate is primarily due to higher
margins on generic prescriptions, lower LIFO charge and lower employee-related costs.
27