Albertsons 2013 Annual Report Download - page 102
Download and view the complete annual report
Please find page 102 of the 2013 Albertsons annual report below. You can navigate through the pages in the report by either clicking on the pages listed below, or by using the keyword search tool below to find specific information within the annual report.-
 1
1 -
2
-
3
-
4
-
5
-
6
-
7
-
8
-
9
-
10
-
11
-
12
-
13
-
14
-
15
-
16
-
17
-
18
-
19
-
20
-
21
-
22
-
23
-
24
-
25
-
26
-
27
-
28
-
29
-
30
-
31
-
32
-
33
-
34
-
35
-
36
-
37
-
38
-
39
-
40
-
41
-
42
-
43
-
44
-
45
-
46
-
47
-
48
-
49
-
50
-
51
-
52
-
53
-
54
-
55
-
56
-
57
-
58
-
59
-
60
-
61
-
62
-
63
-
64
-
65
-
66
-
67
-
68
-
69
-
70
-
71
-
72
-
73
-
74
-
75
-
76
-
77
-
78
-
79
-
80
-
81
-
82
-
83
-
84
-
85
-
86
-
87
-
88
-
89
-
90
-
91
-
 92
92 -
 93
93 -
 94
94 -
 95
95 -
 96
96 -
 97
97 -
 98
98 -
 99
99 -
 100
100 -
 101
101 -
 102
102 -
 103
103 -
 104
104 -
 105
105 -
 106
106 -
 107
107 -
 108
108 -
 109
109 -
 110
110 -
 111
111 -
 112
112 -
113
-
114
-
115
-
116
-
117
-
118
-
119
-
120
-
121
-
122
-
123
-
124
-
125
-
126
-
127
-
128
-
129
-
130
-
131
-
132
 |
 |

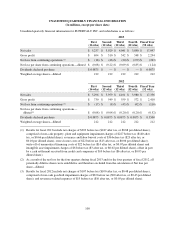
UNAUDITED QUARTERLY FINANCIAL INFORMATION
(In millions, except per share data)
Unaudited quarterly financial information for SUPERVALU INC. and subsidiaries is as follows:
2013
First
(16 wks)
Second
(12 wks)
Third
(12 wks)
Fourth
(12 wks)
Fiscal Year
(52 wks)
Net sales $ 5,237 $ 3,929 $ 4,041 $ 3,890 $ 17,097
Gross profit $ 694 $ 510 $ 542 $ 548 $ 2,294
Net loss from continuing operations (1) $ (18) $ (46) $ (20) $ (179) $ (263)
Net loss per share from continuing operations—diluted $ (0.08) $ (0.22) $ (0.09) $ (0.85) $ (1.24)
Dividends declared per share $ 0.0875 $ — $ — $ — $ 0.0875
Weighted average shares—diluted 212 212 212 212 212
2012
First
(16 wks)
Second
(12 wks)
Third
(12 wks)
Fourth
(12 wks)
Fiscal Year
(52 wks)
Net sales $ 5,296 $ 3,959 $ 4,101 $ 3,980 $ 17,336
Gross profit $ 730 $ 549 $ 559 $ 572 $ 2,410
Net loss from continuing operations (3) $ (17) $ (8) $ (43) $ (42) $ (110)
Net loss per share from continuing operations—
diluted (2) $ (0.08) $ (0.04) $ (0.20) $ (0.20) $ (0.52)
Dividends declared per share $ 0.0875 $ 0.0875 $ 0.0875 $ 0.0875 $ 0.3500
Weighted average shares—diluted 212 212 212 212 212
(1) Results for fiscal 2013 include net charges of $303 before tax ($187 after tax, or $0.88 per diluted share),
comprised of non-cash property, plant and equipment impairment charges of $227 before tax ($140 after
tax, or $0.66 per diluted share), severance and labor buyout costs of $36 before tax ($23 after tax, or
$0.10 per diluted share), store closure costs of $22 before tax ($13 after tax, or $0.06 per diluted share),
write-off of unamortized financing costs of $22 before tax ($14 after tax, or $0.07 per diluted share) and
intangible asset impairment charges of $6 before tax ($3 after tax, or $0.02 per diluted share), offset in part
by a cash settlement received from credit card companies of $10 before tax ($6 after tax, or $0.03 per
diluted share).
(2) As a result of the net loss for the four quarters during fiscal 2013 and for the four quarters of fiscal 2012, all
potentially dilutive shares were antidilutive and therefore excluded from the calculation of Net loss per
share—diluted.
(3) Results for fiscal 2012 include net charges of $107 before tax ($100 after tax, or $0.48 per diluted share),
comprised of non-cash goodwill impairment charges of $92 before tax ($90 after tax, or $0.43 per diluted
share), and severance-related expenses of $15 before tax ($10 after tax, or $0.05 per diluted share).
100