Albertsons 2013 Annual Report Download - page 80
Download and view the complete annual report
Please find page 80 of the 2013 Albertsons annual report below. You can navigate through the pages in the report by either clicking on the pages listed below, or by using the keyword search tool below to find specific information within the annual report.-
 1
1 -
2
-
3
-
4
-
5
-
6
-
7
-
8
-
9
-
10
-
11
-
12
-
13
-
14
-
15
-
16
-
17
-
18
-
19
-
20
-
21
-
22
-
23
-
24
-
25
-
26
-
27
-
28
-
29
-
30
-
31
-
32
-
33
-
34
-
35
-
36
-
37
-
38
-
39
-
40
-
41
-
42
-
43
-
44
-
45
-
46
-
47
-
48
-
49
-
50
-
51
-
52
-
53
-
54
-
55
-
56
-
57
-
58
-
59
-
60
-
61
-
62
-
63
-
64
-
65
-
66
-
67
-
68
-
69
-
 70
70 -
 71
71 -
 72
72 -
 73
73 -
 74
74 -
 75
75 -
 76
76 -
 77
77 -
 78
78 -
 79
79 -
 80
80 -
 81
81 -
 82
82 -
 83
83 -
 84
84 -
 85
85 -
 86
86 -
 87
87 -
 88
88 -
 89
89 -
 90
90 -
91
-
92
-
93
-
94
-
95
-
96
-
97
-
98
-
99
-
100
-
101
-
102
-
103
-
104
-
105
-
106
-
107
-
108
-
109
-
110
-
111
-
112
-
113
-
114
-
115
-
116
-
117
-
118
-
119
-
120
-
121
-
122
-
123
-
124
-
125
-
126
-
127
-
128
-
129
-
130
-
131
-
132
 |
 |

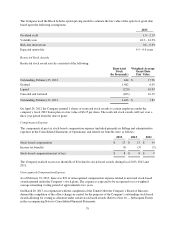
To determine the fair value under the performance grant, the Company uses the Monte Carlo method. The significant
assumptions relating to the valuation of the Company’s LTIP performance awards consisted of the following:
2012
Dividend yield 0.0 – 4.6%
Volatility rate 47.0 – 51.6%
Risk-free interest rate 0.2 – 1.2%
Expected life 1.2 – 3.1 years
The grant date fair value of the 2012 LTIP award was $2.40 per share. The fair value of the cash settled portion
of the award is classified as a liability and is remeasured each reporting period. As of February 23, 2013 the fair
value of the cash portion of the award was $0.03 per share. The minimum payout value of cash and stock is $0
and the aggregate maximum amount the Company could be required to payout is $177.
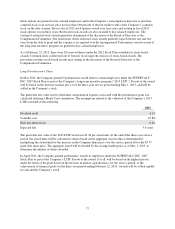
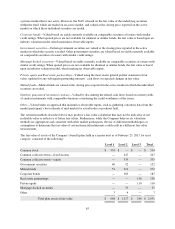
Stock Options
Stock options granted, exercised and outstanding consisted of the following:
Shares
Under Option
(In thousands)
Weighted
Average
Exercise Price
Weighted Average
Remaining
Contractual Term
(In years)
Aggregate
Intrinsic Value
(In thousands)
Outstanding, February 25, 2012 18,413 $ 28.90
Granted 9,370 2.54
Exercised (9) 2.28
Canceled and forfeited (5,528) 23.32
Outstanding, February 23, 2013 22,246 $ 19.20 4.63 $ 10,402
Vested and expected to vest in the
future as of February 23, 2013 21,001 $ 20.15 4.34 $ 9,117
Exercisable as of February 23, 2013 13,242 $ 29.73 1.69 $ 113
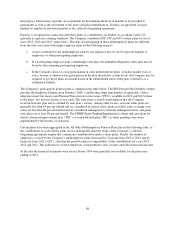
On July 17, 2012, the Company’s Board of Directors granted non-qualified stock options to the Company’s Chief
Executive Officer, and the Board of Directors granted non-qualified stock options to certain employees, under the
Company’s 2012 Stock Plan. The Company granted 8 stock options with a weighted average grant date fair value
of $0.98 per share as part of a broad-based employee incentive initiative designed to retain and motivate
employees across the Company as it pursues its business transformation strategy. These options vest over three
years.
On February 4, 2013, the Company’s Board of Directors granted 2 stock options to the Company’s Chief
Executive Officer. The stock options have a grant date fair of $1.40 per share. These options vest over three
years. The Company used the Black Scholes option pricing model to estimate the fair value of the options at
grant date based upon the following assumptions.
78