Albertsons 2013 Annual Report Download - page 41
Download and view the complete annual report
Please find page 41 of the 2013 Albertsons annual report below. You can navigate through the pages in the report by either clicking on the pages listed below, or by using the keyword search tool below to find specific information within the annual report.-
 1
1 -
2
-
3
-
4
-
5
-
6
-
7
-
8
-
9
-
10
-
11
-
12
-
13
-
14
-
15
-
16
-
17
-
18
-
19
-
20
-
21
-
22
-
23
-
24
-
25
-
26
-
27
-
28
-
29
-
30
-
 31
31 -
 32
32 -
 33
33 -
 34
34 -
 35
35 -
 36
36 -
 37
37 -
 38
38 -
 39
39 -
 40
40 -
 41
41 -
 42
42 -
 43
43 -
 44
44 -
 45
45 -
 46
46 -
 47
47 -
 48
48 -
 49
49 -
 50
50 -
 51
51 -
52
-
53
-
54
-
55
-
56
-
57
-
58
-
59
-
60
-
61
-
62
-
63
-
64
-
65
-
66
-
67
-
68
-
69
-
70
-
71
-
72
-
73
-
74
-
75
-
76
-
77
-
78
-
79
-
80
-
81
-
82
-
83
-
84
-
85
-
86
-
87
-
88
-
89
-
90
-
91
-
92
-
93
-
94
-
95
-
96
-
97
-
98
-
99
-
100
-
101
-
102
-
103
-
104
-
105
-
106
-
107
-
108
-
109
-
110
-
111
-
112
-
113
-
114
-
115
-
116
-
117
-
118
-
119
-
120
-
121
-
122
-
123
-
124
-
125
-
126
-
127
-
128
-
129
-
130
-
131
-
132
 |
 |
by asset class, and historical long-term investment performance. The 10-year annual average rate of return on
pension assets for fiscal 2013 and fiscal 2012 are lower than the assumed long-term rate of return of 7.25 and
7.50 percent due to the unprecedented decline in the economy and the credit market turmoil during fiscal 2008
and 2009. The 10 year rolling average annualized return for investments made in a manner consistent with our
target allocations have generated average returns of approximately 8.1 percent based on returns from 1990 to
2012. The Company expects that the markets will recover to the assumed long-term rate of return. In accordance
with accounting standards, actual results that differ from the Company’s assumptions are accumulated and
amortized over future periods and, therefore, affect expense and obligations in future periods.
At February 25, 2012, the Company converted to the 2012 Static Mortality Table for Annuitants and Non-
Annuitants for calculating the pension and postretirement obligations and the fiscal expense. The impact of this
change increased the February 25, 2012 projected benefit obligation by $10 and the accumulated postretirement
benefit obligation by $1. This change increased the fiscal 2013 defined benefit pension plans expense by $2. The
Static Mortality Table for Annuitants and Non-Annuitants is published annually and reflects a static projection of
mortality improvements which are projected forward each year. The Company used the 2013 Static Mortality
Table for Annuitants and Non-Annuitants to calculate the pension and postretirement obligations.
During 2013, the Company contributed $93 to its defined benefit pension plans. In addition the Company
contributed $5 to its postretirement benefit plans in fiscal 2013, and expects to contribute approximately $118 to
its defined benefit pension plans and approximately $7 to its postretirement benefit plans in fiscal 2014.
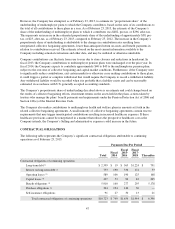
For fiscal 2014, each 25 basis point reduction in the discount rate would increase pension expense by
approximately $12 and each 25 basis point reduction in expected return on plan assets would increase pension
expense by approximately $6. Similarly, for postretirement benefits, a 100 basis point increase in the healthcare
cost trend rate would increase the accumulated postretirement benefit obligation as of the end of fiscal 2013, by
approximately $10 and would increase service and interest cost by $1. Conversely, a 100 basis point decrease in
the healthcare cost trend rate would decrease the accumulated postretirement benefit obligation as of the end of
fiscal 2013 by approximately $7 and would decrease service and interest cost by $1. Although the Company
believes that its assumptions are appropriate, the actuarial assumptions may differ from actual results due to
changing market and economic conditions, higher or lower withdrawal rates and longer or shorter life spans of
participants.
Income Taxes
The Company’s current and deferred tax provision is based on estimates and assumptions that could materially
differ from the actual results reflected in its income tax returns filed during the subsequent year and could
significantly affect the effective tax rate and cash flows in future years.
The Company recognizes deferred tax assets and liabilities for the expected tax consequences of temporary
differences between the tax bases of assets and liabilities and their reported amounts using enacted tax rates in
effect for the year in which it expects the differences to reverse.
The Company’s effective tax rate is influenced by tax planning opportunities available in the various
jurisdictions in which the Company operates. Management’s judgment is involved in determining the effective
tax rate and in evaluating the ultimate resolution of any uncertain tax positions. In addition, the Company is
currently in various stages of audits, appeals or other methods of review with taxing authorities from various
taxing jurisdictions. The Company establishes liabilities for unrecognized tax benefits in a variety of taxing
jurisdictions when, despite management’s belief that the Company’s tax return positions are supportable, certain
positions may be challenged and may need to be revised. The Company adjusts these liabilities in light of
changing facts and circumstances, such as the progress of a tax audit. The effective income tax rate includes the
impact of reserve provisions and changes to those reserves. The Company also provides interest on these
liabilities at the appropriate statutory interest rate. The actual benefits ultimately realized for tax positions may
differ from the Company’s estimates due to changes in facts, circumstances and new information. As of
February 23, 2013 and February 25, 2012, the Company had $187 and $165 of unrecognized tax benefits,
respectively.
39