Albertsons 2013 Annual Report Download - page 65
Download and view the complete annual report
Please find page 65 of the 2013 Albertsons annual report below. You can navigate through the pages in the report by either clicking on the pages listed below, or by using the keyword search tool below to find specific information within the annual report.-
 1
1 -
2
-
3
-
4
-
5
-
6
-
7
-
8
-
9
-
10
-
11
-
12
-
13
-
14
-
15
-
16
-
17
-
18
-
19
-
20
-
21
-
22
-
23
-
24
-
25
-
26
-
27
-
28
-
29
-
30
-
31
-
32
-
33
-
34
-
35
-
36
-
37
-
38
-
39
-
40
-
41
-
42
-
43
-
44
-
45
-
46
-
47
-
48
-
49
-
50
-
51
-
52
-
53
-
54
-
 55
55 -
 56
56 -
 57
57 -
 58
58 -
 59
59 -
 60
60 -
 61
61 -
 62
62 -
 63
63 -
 64
64 -
 65
65 -
 66
66 -
 67
67 -
 68
68 -
 69
69 -
 70
70 -
 71
71 -
 72
72 -
 73
73 -
 74
74 -
 75
75 -
76
-
77
-
78
-
79
-
80
-
81
-
82
-
83
-
84
-
85
-
86
-
87
-
88
-
89
-
90
-
91
-
92
-
93
-
94
-
95
-
96
-
97
-
98
-
99
-
100
-
101
-
102
-
103
-
104
-
105
-
106
-
107
-
108
-
109
-
110
-
111
-
112
-
113
-
114
-
115
-
116
-
117
-
118
-
119
-
120
-
121
-
122
-
123
-
124
-
125
-
126
-
127
-
128
-
129
-
130
-
131
-
132
 |
 |

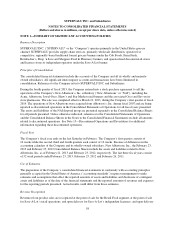
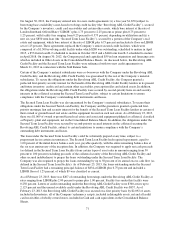
The Company groups long-lived assets with other assets at the lowest level for which identifiable cash flows are
largely independent of the cash flows of other assets, which historically has been at the geographic market level.
The Company reviewed its long-lived asset grouping policy during the fourth quarter of fiscal 2013. During the
review, the Company determined it would be more appropriate to evaluate long-lived assets for impairment at the
store level of a geographic market within the Save-A-Lot segment which continued to show higher indicators of
economic decline, and which led to revised operating market strategies. The Company determined that
impairment of the long-lived assets within this asset group had occurred based on reviewing estimated cash
flows, which were less than their carrying values. During the fourth quarter of fiscal 2013, based upon the results
of impairment testing which indicated the carrying value exceeded the fair value of the revised asset group, the
Company recorded a pre-tax non-cash impairment charge of approximately $8 related to a store level impairment
review and a charge related to a geographic market in the Company’s Save-A-Lot segment.
Due to the ongoing business transformation and highly competitive environment, the Company will continue to
evaluate its long-lived asset policy and current asset groups, to determine if additional modifications to the policy
are necessary. Future changes to the Company’s assessment of its long-lived asset policy and changes in
circumstances, operating results or other events may result in additional asset impairment testing and charges.
During fiscal 2013, the Company announced the closure of approximately 22 non-strategic stores within the
Save-A-Lot segment including the exit of a geographic market, resulting in an impairment of $16 related to these
stores’ long-lived assets. Refer to Note 3—Reserves for Closed Properties and Property, Plant and Equipment-
Related Charges in the accompanying Notes to Consolidated Financial Statements.
In addition, the Company recorded an impairment charge of $5 in the Independent Business segment, based upon
the results of impairment testing which indicated the carrying value exceeded the fair value of a distribution
center held and used in operations.
Deferred Rent
The Company recognizes rent holidays, including the time period during which the Company has access to the
property prior to the opening of the site, as well as construction allowances and escalating rent provisions, on a
straight-line basis over the term of the operating lease. The deferred rents are included in Other current liabilities
and Other long-term liabilities in the Consolidated Balance Sheets.
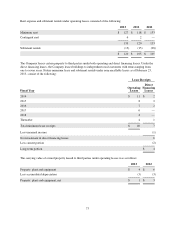
Self-Insurance Liabilities
The Company is primarily self-insured for workers’ compensation, automobile and general liability costs. It is
the Company’s policy to record its self-insurance liabilities based on management’s estimate of the ultimate cost
of reported claims and claims incurred but not yet reported and related expenses, discounted at a risk-free interest
rate. The present value of such claims was calculated using discount rates ranging from 0.4 percent to 5.1 percent
for fiscal 2013, 0.4 percent to 5.1 percent for fiscal 2012, and 0.6 percent to 5.1 percent for fiscal 2011.
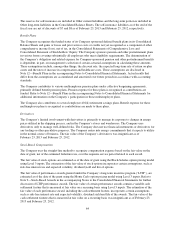
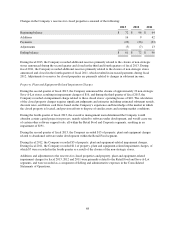
Changes in the Company’s self-insurance liabilities consisted of the following:
2013 2012 2011
Beginning balance $ 81 $ 83 $ 77
Expense 29 23 32
Claim payments (27) (25) (26)
Ending balance 83 81 83
Less current portion (27) (26) (27)
Long-term portion $ 56 $ 55 $ 56
63