Albertsons 2013 Annual Report Download - page 49
Download and view the complete annual report
Please find page 49 of the 2013 Albertsons annual report below. You can navigate through the pages in the report by either clicking on the pages listed below, or by using the keyword search tool below to find specific information within the annual report.-
 1
1 -
2
-
3
-
4
-
5
-
6
-
7
-
8
-
9
-
10
-
11
-
12
-
13
-
14
-
15
-
16
-
17
-
18
-
19
-
20
-
21
-
22
-
23
-
24
-
25
-
26
-
27
-
28
-
29
-
30
-
31
-
32
-
33
-
34
-
35
-
36
-
37
-
38
-
 39
39 -
 40
40 -
 41
41 -
 42
42 -
 43
43 -
 44
44 -
 45
45 -
 46
46 -
 47
47 -
 48
48 -
 49
49 -
 50
50 -
 51
51 -
 52
52 -
 53
53 -
 54
54 -
 55
55 -
 56
56 -
 57
57 -
 58
58 -
 59
59 -
60
-
61
-
62
-
63
-
64
-
65
-
66
-
67
-
68
-
69
-
70
-
71
-
72
-
73
-
74
-
75
-
76
-
77
-
78
-
79
-
80
-
81
-
82
-
83
-
84
-
85
-
86
-
87
-
88
-
89
-
90
-
91
-
92
-
93
-
94
-
95
-
96
-
97
-
98
-
99
-
100
-
101
-
102
-
103
-
104
-
105
-
106
-
107
-
108
-
109
-
110
-
111
-
112
-
113
-
114
-
115
-
116
-
117
-
118
-
119
-
120
-
121
-
122
-
123
-
124
-
125
-
126
-
127
-
128
-
129
-
130
-
131
-
132
 |
 |
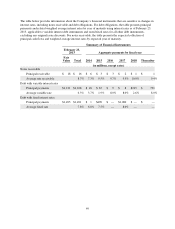
However, the Company has attempted, as of February 23, 2013, to estimate its “proportionate share” of the
underfunding of multiemployer plans to which the Company contributes, based on the ratio of its contributions to
the total of all contributions to these plans in a year. As of February 23, 2013, the estimate of the Company’s
share of the underfunding of multiemployer plans to which it contributes was $482, pre-tax, or $296, after-tax.
This represents an increase in the estimated proportionate share of the underfunding of approximately $38, pre-
tax, or $23, after-tax, as of February 23, 2013, compared to February 25, 2012. The increase in the Company’s
proportionate share of underfunding is attributable to the changes in contribution rates resulting from
renegotiated collective bargaining agreements, lower than anticipated return on assets and benefit payments in
relation to contributions received. The estimate is based on the most current information available to the
Company including actuarial evaluations and other data, and may be outdated or otherwise unreliable.
Company contributions can fluctuate from year to year due to store closures and reductions in headcount. In
fiscal 2013, the Company contributions to multiemployer pension plans were unchanged over the prior year. In
fiscal 2014, the Company expects to contribute approximately $40 to $45 to the multiemployer pension plans,
subject to the outcome of collective bargaining and capital market conditions. Furthermore, if the Company were
to significantly reduce contributions, exit certain markets or otherwise cease making contributions to these plans,
it could trigger a partial or complete withdrawal that would require the Company to record a withdrawal liability.
Any withdrawal liability would be recorded when it is probable that a liability exists and can be reasonably
estimated, in accordance with U.S. generally accepted accounting standards.
The Company’s proportionate share of underfunding described above is an estimate and could change based on
the results of collective bargaining efforts, investment returns on the assets held in the plans, actions taken by
trustees who manage the plans’ benefit payments and requirements under the Pension Protection Act of 2006 and
Section 412(e) of the Internal Revenue Code.
The Company also makes contributions to multiemployer health and welfare plans in amounts set forth in the
related collective bargaining agreements. A small minority of collective bargaining agreements contain reserve
requirements that may trigger unanticipated contributions resulting in increased healthcare expenses. If these
healthcare provisions cannot be renegotiated in a manner that reduces the prospective healthcare cost as the
Company intends, the Company’s Selling and administrative expenses could increase in the future.
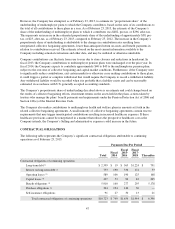
CONTRACTUAL OBLIGATIONS
The following table represents the Company’s significant contractual obligations attributable to continuing
operations as of February 23, 2013.
Payments Due Per Period
Total
Fiscal
2014
Fiscal
2015-
2016
Fiscal
2017-
2018 Thereafter
Contractual obligations of continuing operations:
Long-term debt (1) $ 2,599 $ 19 $ 565 $1,224 $ 791
Interest on long-term debt (2) 733 190 336 174 33
Operating leases (3) 589 106 190 125 168
Capital leases (4) 437 53 96 83 205
Benefit obligations (5) 5,910 160 277 295 5,178
Purchase obligations (6) 364 194 140 30 —
Self-insurance obligations 91 27 30 13 21
Total contractual obligations of continuing operations $10,723 $ 749 $1,634 $1,944 $ 6,396
47