Albertsons 2013 Annual Report Download - page 28
Download and view the complete annual report
Please find page 28 of the 2013 Albertsons annual report below. You can navigate through the pages in the report by either clicking on the pages listed below, or by using the keyword search tool below to find specific information within the annual report.-
 1
1 -
2
-
3
-
4
-
5
-
6
-
7
-
8
-
9
-
10
-
11
-
12
-
13
-
14
-
15
-
16
-
17
-
 18
18 -
 19
19 -
 20
20 -
 21
21 -
 22
22 -
 23
23 -
 24
24 -
 25
25 -
 26
26 -
 27
27 -
 28
28 -
 29
29 -
 30
30 -
 31
31 -
 32
32 -
 33
33 -
 34
34 -
 35
35 -
 36
36 -
 37
37 -
 38
38 -
39
-
40
-
41
-
42
-
43
-
44
-
45
-
46
-
47
-
48
-
49
-
50
-
51
-
52
-
53
-
54
-
55
-
56
-
57
-
58
-
59
-
60
-
61
-
62
-
63
-
64
-
65
-
66
-
67
-
68
-
69
-
70
-
71
-
72
-
73
-
74
-
75
-
76
-
77
-
78
-
79
-
80
-
81
-
82
-
83
-
84
-
85
-
86
-
87
-
88
-
89
-
90
-
91
-
92
-
93
-
94
-
95
-
96
-
97
-
98
-
99
-
100
-
101
-
102
-
103
-
104
-
105
-
106
-
107
-
108
-
109
-
110
-
111
-
112
-
113
-
114
-
115
-
116
-
117
-
118
-
119
-
120
-
121
-
122
-
123
-
124
-
125
-
126
-
127
-
128
-
129
-
130
-
131
-
132
 |
 |

generally subject to renewal upon mutual agreement by the parties thereto and also include termination
provisions that can be exercised by each party.
In addition, on March 26, 2013, the Company announced plans to reduce its national workforce by an estimated
1,100 positions, including current positions and open jobs. These reductions will predominantly occur during the
Company’s first and second quarter of fiscal 2014.
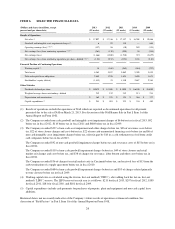
RESULTS OF OPERATIONS
The following discussion summarizes operating results in fiscal 2013 compared to fiscal 2012 and for fiscal 2012
compared to fiscal 2011. As a result of the NAI Banner Sale, the Company has classified the operations
attributable to NAI as discontinued operations for all fiscal years presented. Except where such discontinued
operations are specifically mentioned, the following discussion and analysis of the Company’s financial
condition, changes in financial condition and results of operations are presented on a continuing basis only,
including for past fiscal years. Refer to Note 15—Discontinued Operations and Divestitures in the Notes to
Consolidated Financial Statements included in Part II, Item 8 of this Annual Report on Form 10-K for further
discussion.
(In millions, except per share data)
February 23,
2013 (52 weeks)
February 25,
2012 (52 weeks)
February 26,
2011 (52 weeks)
Net sales $17,097 100.0% $17,336 100.0% $17,357 100.0%
Cost of sales 14,803 86.6 14,926 86.1 14,957 86.2
Gross profit 2,294 13.4 2,410 13.9 2,400 13.8
Selling and administrative expenses 2,445 14.3 2,222 12.8 2,320 13.4
Goodwill and intangible asset impairment charges 6 0.0 92 0.5 110 0.6
Operating earnings (loss) (157) (0.9) 96 0.6 (30) (0.2)
Interest expense, net 269 1.6 247 1.4 230 1.3
Loss from continuing operations before income taxes (426) (2.5) (151) (0.9) (260) (1.5)
Income tax benefit (163) (1.0) (41) (0.2) (60) (0.3)
Net loss from continuing operations (263) (1.5) (110) (0.6) (200) (1.2)
Loss from discontinued operations, net of tax (1,203) (7.0) (930) (5.4) (1,310) (7.5)
Net loss $ (1,466) (8.6)% $ (1,040) (6.0)% $ (1,510) (8.7)%
Basic and diluted net loss per common share:
Continuing operations $ (1.24) $ (0.52) $ (0.94)
Discontinued operations (5.67) (4.39) (6.19)
Basic and diluted net loss per common share $ (6.91) $ (4.91) $ (7.13)
Comparison of fiscal 2013 ended February 23, 2013 and fiscal 2012 ended February 25, 2012:
Summary
Consolidated Net sales for fiscal 2013 were $17,097, compared with $17,336 last year. Net loss from continuing
operations for fiscal 2013 was $263, or $1.24 loss per basic and diluted share, compared with Net loss from
continuing operations of $110, or $0.52 loss per basic and diluted share last year.
26