Albertsons 2007 Annual Report Download - page 76
Download and view the complete annual report
Please find page 76 of the 2007 Albertsons annual report below. You can navigate through the pages in the report by either clicking on the pages listed below, or by using the keyword search tool below to find specific information within the annual report.-
 1
1 -
2
-
3
-
4
-
5
-
6
-
7
-
8
-
9
-
10
-
11
-
12
-
13
-
14
-
15
-
16
-
17
-
18
-
19
-
20
-
21
-
22
-
23
-
24
-
25
-
26
-
27
-
28
-
29
-
30
-
31
-
32
-
33
-
34
-
35
-
36
-
37
-
38
-
39
-
40
-
41
-
42
-
43
-
44
-
45
-
46
-
47
-
48
-
49
-
50
-
51
-
52
-
53
-
54
-
55
-
56
-
57
-
58
-
59
-
60
-
61
-
62
-
63
-
64
-
65
-
 66
66 -
 67
67 -
 68
68 -
 69
69 -
 70
70 -
 71
71 -
 72
72 -
 73
73 -
 74
74 -
 75
75 -
 76
76 -
 77
77 -
 78
78 -
 79
79 -
 80
80 -
 81
81 -
 82
82 -
 83
83 -
 84
84 -
 85
85 -
 86
86 -
87
-
88
-
89
-
90
-
91
-
92
-
93
-
94
-
95
-
96
-
97
-
98
-
99
-
100
-
101
-
102
-
103
-
104
-
105
-
106
-
107
-
108
-
109
-
110
-
111
-
112
-
113
-
114
-
115
-
116
-
117
-
118
-
119
-
120
-
121
-
122
-
123
-
124
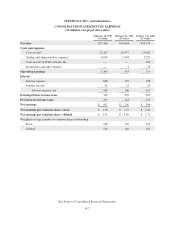
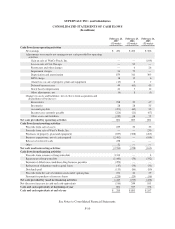
 |
 |
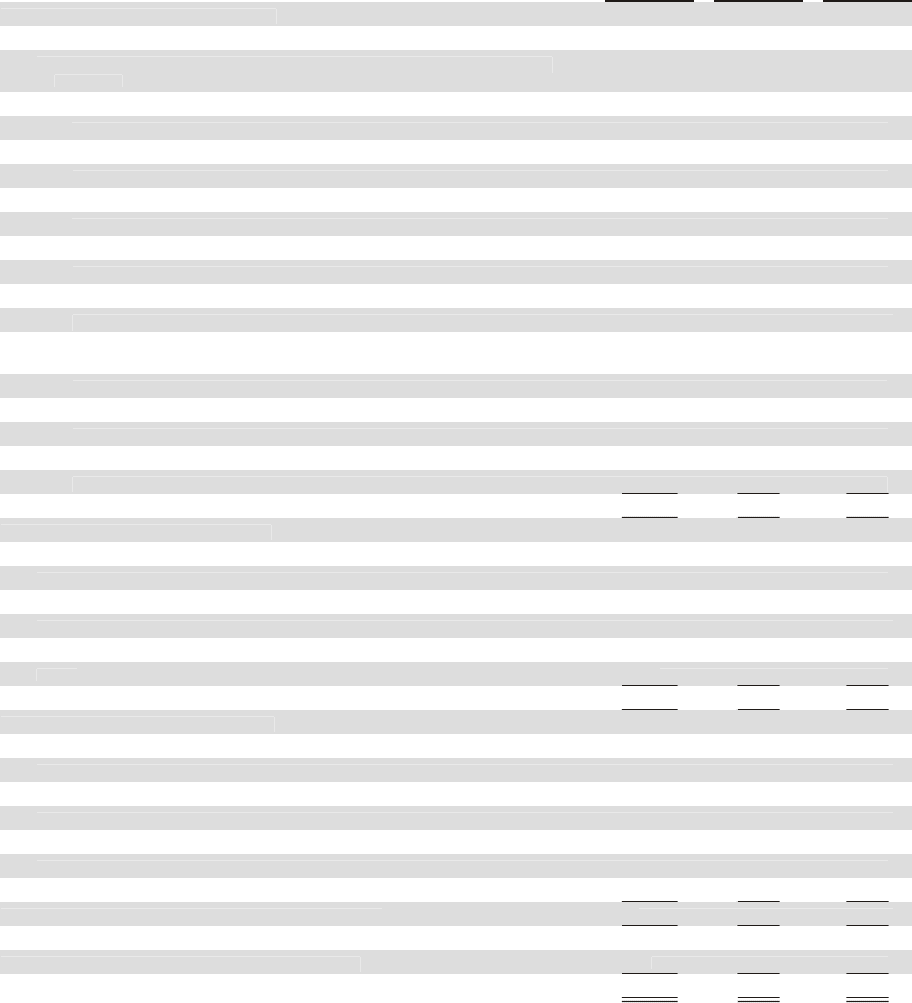
SU
PERVAL
U
IN
C
. and
S
ubsidiaries
CO
N
SO
LIDATED
S
TATEMENT
SO
F
C
A
S
HFL
O
W
S
(
In millions
)
F
ebruar
y
24
,
2
00
7
(
52 weeks
)
F
ebruar
y
25
,
2
006
(
52 weeks
)
F
ebruar
y
26
,
2
005
(
52 weeks
)
C
ash
f
lows
f
rom operat
i
ng act
i
v
i
t
i
es
N
et earnings
$
452
$
206
$
38
6
A
d
j
ustments to reconcile net earnin
g
s to net cash provided b
y
operatin
g
a
cti
v
ities:
G
a
i
nonsa
l
eo
f
W
i
nCo Foo
d
s, Inc. — — (109)
L
oss on sale of Cub Chicago — 9
5—
R
estructure and other char
g
es — 4 2
6
I
mpairment char
g
es 26 73
—
D
eprec
i
at
i
on an
d
amort
i
zat
i
on 879 311 30
3
L
IFO char
g
e1813
6
(
Gain) loss on sale of propert
y
, plant and equipment (15) 6
7
D
eferred income taxes 44 (
6
1) 4
9
S
toc
kb
ase
d
compensat
i
on 42 3 1
2
O
ther ad
j
ustments, net (6) 8 (1)
Ch
anges
i
n assets an
dli
a
bili
t
i
es, net o
f
e
ff
ects
f
rom acqu
i
s
i
t
i
on an
d
di
spos
i
t
i
ons o
fb
us
i
nesses:
R
eceivables 2
5
822 4
7
I
n
v
entories 2
8
2
835
A
ccounts pa
y
able (471) (60) 3
2
I
ncome taxes currently payable (224) (21) (
6
7
)
O
ther assets and liabilities
(
230
)
68 75
N
et cash prov
i
ded by operat
i
ng act
i
v
i
t
i
e
s
8
01 69
5
80
1
C
ash flows from investin
g
activities
P
roceeds from sale of assets 189
5
03
5
P
rocee
d
s
f
rom sa
l
eo
f
W
i
nCo Foo
d
s, Inc. — — 23
0
P
urchases of propert
y
, plant and equipment (837) (308) (263)
B
usiness acquisitions, net of cash acquired (2,402) — (1
6
4)
R
e
l
ease o
f
restr
i
cte
d
cas
h
238 —
—
O
ther
5
2—
—
N
et cash used
i
n
i
nvest
i
ng act
i
v
i
t
i
es (2,760) (2
5
8) (162
)
C
ash
f
lows
f
rom
fi
nanc
i
ng act
i
v
i
t
i
es
P
roceeds from issuance of lon
g
-term debt 3,313 —
4
R
epayment o
fl
ong-term
d
e
b
t (1,443) (70) (332)
P
ayment o
f
A
lb
ertsons stan
d
a
l
one
d
rug
b
us
i
ness paya
bl
es (299) —
—
R
eduction of obli
g
ations under capital leases (47) (34) (33)
D
ividends
p
aid (113) (86) (80)
P
roceeds from the sale of common stock under option plans 2
5
226 39
P
a
y
ment for purchase of treasur
y
shares (220) (29) (56)
N
et cash provided by
(
used in
)
financing activities
1
,443 (193) (4
5
8)
N
et (decrease) increase in cash and cash equivalents (516) 244 18
1
C
ash and cash equivalents at be
g
innin
g
of yea
r
80
1
55
7
3
7
6
C
ash and cash equ
i
valents at end o
f
year
$
285
$
801
$
55
7
See Notes to Consolidated Financial Statements
.
F-
10