Albertsons 2007 Annual Report Download - page 3
Download and view the complete annual report
Please find page 3 of the 2007 Albertsons annual report below. You can navigate through the pages in the report by either clicking on the pages listed below, or by using the keyword search tool below to find specific information within the annual report.
D
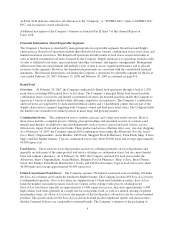
ear SUPERVALU Shareholder
,
T
h
is year’s
l
etter wi
ll
reac
h
a
l
arger s
h
are
h
o
ld
er au
d
ience t
h
an ever
b
e
f
ore in SUPERVALU’s 137-year
h
istory. Wit
h
t
he com
p
letion of our ac
q
uisition of the
p
remier retail
p
ro
p
erties of Albertson’s, Inc. last June, SUPERVALU
create
d
a strong new
b
usiness p
l
at
f
orm – securing a
f
uture wit
h
exce
ll
ent growt
h
opportunities. We remain ever
s
teadfast in our commitment to be res
p
onsible stewards of your investment in our com
p
any.
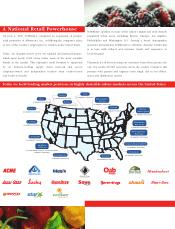
Our new business model now represents a national food and dru
g
retail and supply chain powerhouse with
a
f
ootprint t
h
at spans t
h
e Unite
d
States. Wit
h
t
h
e a
dd
ition o
f
t
h
e Acme, A
lb
ertsons Sout
h
ern Ca
l
i
f
ornia an
d
Intermountain West, Bristol Farms, Luck
y
, Sav-on, Shaw’s, Star and Jewel-Osco brands to our multi-format retai
l
p
ort
f
o
l
io, we are now positione
d
as a nationa
l
p
l
ayer an
d
can ta
k
e a
d
vantage o
f
our retai
l
sca
l
e. Wit
h
near
l
y 80
p
ercent of SUPERVALU’s total sales now comin
g
from our retail store network of approximately 2,500 stores, w
e
h
ave signi
f
icant
l
y res
h
ape
d
SUPERVALU. An
d
, we are one o
f
t
h
e
l
argest grocery supp
l
y c
h
ain operations in t
h
e
c
ountry, serving near
l
y 5,000 retai
l
en
d
points across t
h
e country. A strong supp
l
y c
h
ain
b
ac
kb
one
h
e
l
ps to ensure our success
-
an
d
t
h
at o
f
o
ur inde
p
endent retail customers - in the markets where we do business
.
In the midst of directin
g
SUPERVALU’s transformational chan
g
es, we are focused on creatin
g
a company that is the best
p
lace to work, the
b
est p
l
ace to s
h
op an
d
t
h
e
b
est p
l
ace to invest
i
n our in
d
ustry. To
h
e
l
p measure our progress, we are using
f
our mi
l
estones t
h
at gui
d
e our
d
ecisions, strate
g
ies and initiatives, and our culture of service. In this letter, I will share these milestones with you, tell
y
ou wh
y
the
y
are
i
mportant to our sustained success, and provide insi
g
ht into how we are supportin
g
them.
M
i
l
estone #1 – De
l
ivering t
h
e Economics
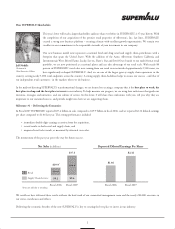
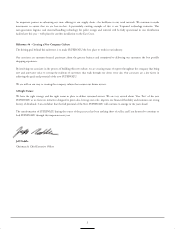
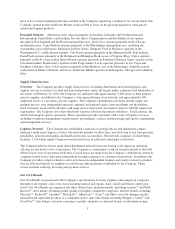
In Fiscal 2007 SUPERVALU re
p
orted
$
37.4 billion in sales com
p
ared to
$
19.9 billion in fiscal 2006, and we re
p
orted
$
2.32 dilut
e
d earnin
g
s
p
er share compared to $1.46 last year. This strong performance included
:
•
immediate double-di
g
it earnin
g
s accretion from the acquisition
,
•
recor
d
resu
l
ts in
b
ot
h
retai
l
an
d
supp
l
y c
h
ain, an
d
•
im
p
roved retail sales trends, as measured by identical store sales.
T
he momentum of the
p
ast year
p
aves the way for future success.
We cou
ld
not
h
ave
d
e
l
ivere
d
t
h
ese resu
l
ts wit
h
out t
h
e
h
ar
d
wor
k
o
f
our committe
d
management team an
d
t
h
e near
l
y 200,000 associ
a
t
es
in
o
ur stores
,
warehouses and offices
.
Deliverin
g
the economic benefits of the new SUPERVALU is key to creatin
g
the best place to invest in our industry
.
1
Net
S
a
l
es
(
in Bi
ll
ions
)
$
19.9
$
37.4
$
10.6
$
28.
0
$
9.2
$
9.4
Fi
sca
l 2
006
F
iscal 200
7
S
upp
l
y C
h
ain Service
s
Reta
i
l
Reporte
d
Di
l
ute
d
Earnin
g
s Per S
h
ar
e
$
1.4
6
$
2.32
F
isca
l
2006 Fiscal 200
7
*
Does not add due to rounding
*
J
eff Noddl
e
Chairman
&
Chief Exec
u
tive Officer

