Albertsons 2007 Annual Report Download - page 30
Download and view the complete annual report
Please find page 30 of the 2007 Albertsons annual report below. You can navigate through the pages in the report by either clicking on the pages listed below, or by using the keyword search tool below to find specific information within the annual report.-
 1
1 -
2
-
3
-
4
-
5
-
6
-
7
-
8
-
9
-
10
-
11
-
12
-
13
-
14
-
15
-
16
-
17
-
18
-
19
-
 20
20 -
 21
21 -
 22
22 -
 23
23 -
 24
24 -
 25
25 -
 26
26 -
 27
27 -
 28
28 -
 29
29 -
 30
30 -
 31
31 -
 32
32 -
 33
33 -
 34
34 -
 35
35 -
 36
36 -
 37
37 -
 38
38 -
 39
39 -
 40
40 -
41
-
42
-
43
-
44
-
45
-
46
-
47
-
48
-
49
-
50
-
51
-
52
-
53
-
54
-
55
-
56
-
57
-
58
-
59
-
60
-
61
-
62
-
63
-
64
-
65
-
66
-
67
-
68
-
69
-
70
-
71
-
72
-
73
-
74
-
75
-
76
-
77
-
78
-
79
-
80
-
81
-
82
-
83
-
84
-
85
-
86
-
87
-
88
-
89
-
90
-
91
-
92
-
93
-
94
-
95
-
96
-
97
-
98
-
99
-
100
-
101
-
102
-
103
-
104
-
105
-
106
-
107
-
108
-
109
-
110
-
111
-
112
-
113
-
114
-
115
-
116
-
117
-
118
-
119
-
120
-
121
-
122
-
123
-
124
 |
 |
Supply chain services sales for fiscal 2006 were
$
9,229 compared with
$
8,994 in fiscal 2005, an increase of 2.6
percent, pr
i
mar
il
yre
fl
ect
i
ng new
b
us
i
ness
f
rom t
h
e tra
di
t
i
ona
lf
oo
ddi
str
ib
ut
i
on
b
us
i
ness, t
h
e acqu
i
s
i
t
i
on o
f
Tota
l
Lo
g
istics and temporar
y
new business of approximatel
y
three percent, three percent and two percent,
respectively, partially offset by customer attrition, which includes the fiscal 2006 impact of cycling three larg
e
customer trans
i
t
i
ons to ot
h
er supp
li
ers
i
nt
h
epr
i
or year.
G
ross Pro
fit
Gross profit, as a percent of Net sales, was 14.5 percent for fiscal 2006 compared with 14.6 percent in fisca
l
200
5
. Gross profit, as a percent of Net sales, primaril
y
reflects the benefits of retail merchandisin
g
execution an
d
the acquisition of Total Logistics, which was more than offset by the impact of Supply chain services costs of
a
pproximately
$
22 related to costs for new growth initiatives for supply chain technology and the launch of our
specialt
y
produce distribution business, W. Newell and Co. and approximatel
y
$1 of losses related to minorit
y
o
wned investments in contrast to
$
14 of earnings in fiscal 2005
.
S
ellin
g
and Administrative Expense
s
Selling and administrative expenses, as a percentage of Net sales, were 12.3 percent for fiscal 2006 compare
d
with 11.4 percent in fiscal 2005. The increase primarily reflects approximately
$
174 of pre-tax costs primaril
y
related to char
g
es for Chica
g
o and Pittsbur
g
h
.
R
estructure and Other Char
g
es
For fiscal 2006 and fiscal 2005, the Compan
y
incurred $4 and $26, respectivel
y
, in pre-tax restructure and othe
r
charges. These charges primarily reflect changes in estimates on exited real estate for fiscal 2006 and the
i
ncrease
dli
a
bili
t
i
es assoc
i
ate
d
w
i
t
h
emp
l
oyee
b
ene
fi
ts re
l
ate
d
costs
f
rom prev
i
ous
l
yex
i
te
ddi
str
ib
ut
i
on
f
ac
ili
t
i
es
a
s well as chan
g
es in estimates on exited real estate for fiscal 200
5
.
O
peratin
g
Earnin
g
s
Operatin
g
earnin
g
s for fiscal 2006 were $435 compared with $716 in fiscal 2005. Results for fiscal 2006 includ
e
charges of approximately
$
174 pre-tax primarily related to Chicago and Pittsburgh. Fiscal 2005 includes a
pre-tax gain of approximately
$
109 on the sale of WinCo and
$
26 of restructure and other charges. Retail food
Operatin
g
earnin
g
s were $269, or 2.5 percent of Retail food Net sales, compared to fiscal 2005 Retail food
Operating earnings of
$
446, or 4.2 percent of Retail food Net sales. The decrease in Retail food Operating
earnings, as a percent of Retail food Net sales, reflects charges of approximately
$
174 pre-tax primarily related t
o
C
hica
g
o and Pittsbur
g
h. Suppl
y
chain services Operatin
g
earnin
g
s were $214, or 2.3 percent of Suppl
y
chain
services Net sales compared to fiscal 2005 Supply chain services Operating earnings of
$
235, or 2.6 percent o
f
Supp
l
yc
h
a
i
n serv
i
ces Net sa
l
es. T
h
e
d
ecrease
i
n Supp
l
yc
h
a
i
n serv
i
ces Operat
i
ng earn
i
ngs, as a percent o
f
Suppl
y
chain services Net sales, primaril
y
reflects the start-up costs related to
g
rowth initiatives and losses fro
m
minority owned investments, which more than offset the benefit of the higher margin third party logistic
s
business acquired in 2005.
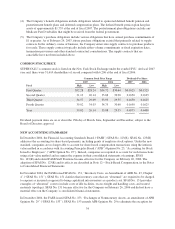
N
et
I
nterest
E
xpens
e
Net interest expense decreased to
$
106 for fiscal 2006 compared with
$
115 in fiscal 2005. The decreas
e
primaril
y
reflects lower borrowin
g
levels partiall
y
offset b
y
hi
g
her borrowin
g
rates and the absence of the $6
early redemption costs relating to the
$
250 notes redeemed in the first quarter of fiscal 2005.
I
n
co
m
e
T
a
x
es
T
he effective tax rate was 37.4 percent and 3
5
.8 percent for fiscal 2006 and fiscal 200
5
, respectively. The fiscal
2005 tax rate reflects the impact of net favorable tax settlements.
24