Albertsons 2007 Annual Report Download - page 68
Download and view the complete annual report
Please find page 68 of the 2007 Albertsons annual report below. You can navigate through the pages in the report by either clicking on the pages listed below, or by using the keyword search tool below to find specific information within the annual report.-
 1
1 -
2
-
3
-
4
-
5
-
6
-
7
-
8
-
9
-
10
-
11
-
12
-
13
-
14
-
15
-
16
-
17
-
18
-
19
-
20
-
21
-
22
-
23
-
24
-
25
-
26
-
27
-
28
-
29
-
30
-
31
-
32
-
33
-
34
-
35
-
36
-
37
-
38
-
39
-
40
-
41
-
42
-
43
-
44
-
45
-
46
-
47
-
48
-
49
-
50
-
51
-
52
-
53
-
54
-
55
-
56
-
57
-
 58
58 -
 59
59 -
 60
60 -
 61
61 -
 62
62 -
 63
63 -
 64
64 -
 65
65 -
 66
66 -
 67
67 -
 68
68 -
 69
69 -
 70
70 -
 71
71 -
 72
72 -
 73
73 -
 74
74 -
 75
75 -
 76
76 -
 77
77 -
 78
78 -
79
-
80
-
81
-
82
-
83
-
84
-
85
-
86
-
87
-
88
-
89
-
90
-
91
-
92
-
93
-
94
-
95
-
96
-
97
-
98
-
99
-
100
-
101
-
102
-
103
-
104
-
105
-
106
-
107
-
108
-
109
-
110
-
111
-
112
-
113
-
114
-
115
-
116
-
117
-
118
-
119
-
120
-
121
-
122
-
123
-
124
 |
 |

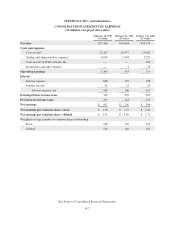
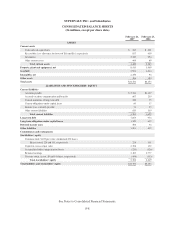
SU
PERVAL
U
IN
C
. AND
S
ubsidiarie
s
F
IVE YEAR FINAN
C
IAL AND
O
PERATIN
GSU
MMAR
Y
(
In millions
)
200
7
2006
2005
2004
2003
S
tatement of Earnings Data
(
a
)
N
et sales $37
,
406 $19
,
864 $19
,
543 $20
,
210 $19
,
16
0
C
ost of sales 29
,
267 16
,
977 16
,
681 17
,
373 16
,
567
S
elling and administrative expenses
6
,834 2,448 2,229 2,220 2,020
G
a
i
nonsa
l
eo
f
W
i
nCo Foo
d
s, Inc. — — 109 — —
R
estructure and other char
g
es — 4 26 16 3
O
perating earnings 1,30
5
43
5
716 601
5
7
0
I
nterest, net
55
8 106 11
5
146 16
2
E
arnin
g
s before income taxes 747 329 601 455 408
P
rovision for income taxes 2
9
5 123 215 175 15
1
N
et earnings 4
5
2 206 386 280 2
5
7
N
et earnin
g
s per common share—diluted 2.32 1.46 2.71 2.01 1.8
6
B
alance Sheet Data
(
a
)
I
nventories
(
FIFO
)(
b
)
$ 2,927 $ 1,114 $ 1,181 $ 1,214 $ 1,19
5
W
orkin
g
capital (b) 67 821 643 361 289
P
roperty, plant and equipment, net 8,41
5
1,969 2,191 2,126 2,209
T
otal assets 21
,
702 6
,
153 6
,
274 6
,
162 5
,
89
6
L
on
g
-term debt (c) 9,192 1,406 1,579 1,634 2,020
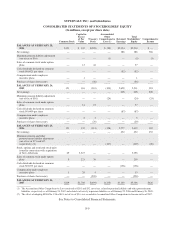
S
tockholders’ equity
5
,306 2,619 2,
5
11 2,210 2,009
O
ther Statistics
(
a
)
N
et earn
i
ngs as a percent o
f
net sa
l
es 1.21% 1.04% 1.97% 1.39% 1.34%
R
eturn on average stockholders’ equity 9.61% 7.9
5
% 16.24% 13.29% 12.97%
B
ook value
p
er common share $ 25.40 $ 19.20 $ 18.53 $ 16.40 $ 15.0
3
C
urrent ratio
(
b
)
0.99:1 1.51:1 1.40:1 1.20:1 1.19:
1
D
ebt to capital ratio (d) 64.1% 36.7% 40.1% 46.7%
5
1.8%
D
ividends declared
p
er common share $0.6575 $0.6400 $0.6025 $0.5775 $0.567
5
W
ei
g
hted avera
g
e common shares outstandin
g
—diluted 196 146 145 143 143
D
epreciation and amortization
$
879
$
311
$
303
$
302
$
297
C
apital expenditures (e)
$
927
$
365
$
326
$
371
$
43
9
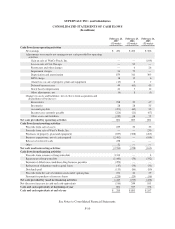
N
et cash provided b
y
operatin
g
activities $ 801 $ 695 $ 801 $ 847 $ 584
N
et cash used in investing activities
$
(2,760)
$
(258)
$
(162)
$
(272)
$
(331)
N
et cash provided by (used in) financing activities
$
1,443
$
(193)
$
(458)
$
(312)
$
(236)
F-
2