Albertsons 2007 Annual Report Download - page 27
Download and view the complete annual report
Please find page 27 of the 2007 Albertsons annual report below. You can navigate through the pages in the report by either clicking on the pages listed below, or by using the keyword search tool below to find specific information within the annual report.-
 1
1 -
2
-
3
-
4
-
5
-
6
-
7
-
8
-
9
-
10
-
11
-
12
-
13
-
14
-
15
-
16
-
 17
17 -
 18
18 -
 19
19 -
 20
20 -
 21
21 -
 22
22 -
 23
23 -
 24
24 -
 25
25 -
 26
26 -
 27
27 -
 28
28 -
 29
29 -
 30
30 -
 31
31 -
 32
32 -
 33
33 -
 34
34 -
 35
35 -
 36
36 -
 37
37 -
38
-
39
-
40
-
41
-
42
-
43
-
44
-
45
-
46
-
47
-
48
-
49
-
50
-
51
-
52
-
53
-
54
-
55
-
56
-
57
-
58
-
59
-
60
-
61
-
62
-
63
-
64
-
65
-
66
-
67
-
68
-
69
-
70
-
71
-
72
-
73
-
74
-
75
-
76
-
77
-
78
-
79
-
80
-
81
-
82
-
83
-
84
-
85
-
86
-
87
-
88
-
89
-
90
-
91
-
92
-
93
-
94
-
95
-
96
-
97
-
98
-
99
-
100
-
101
-
102
-
103
-
104
-
105
-
106
-
107
-
108
-
109
-
110
-
111
-
112
-
113
-
114
-
115
-
116
-
117
-
118
-
119
-
120
-
121
-
122
-
123
-
124
 |
 |

prices and modest product cost inflation. For fiscal 2008, we expect consumer spending will be impacted by high
f
ue
l
pr
i
ces, cont
i
nue
df
oo
di
n
fl
at
i
on an
d
t
h
eso
f
t
h
ous
i
ng mar
k
et
.
T
h
e Compan
y
’s P
l
a
n
We
b
e
li
eve we can
b
e success
f
u
l
a
g
a
i
nst t
hi
s
i
n
d
ustr
yb
ac
kd
rop w
i
t
h
our re
gi
ona
l
reta
il f
ormats t
h
at
f
ocus o
n
l
ocal execution, merchandisin
g
and consumer knowled
g
e. In addition, our operations will benefit from our
e
ffi
c
i
ent an
dl
ow-cost supp
l
yc
h
a
i
nan
d
new econom
i
es o
f
sca
l
easwe
l
everage our Reta
il f
oo
d
an
d
Supp
l
yc
h
a
i
n
serv
i
ces operat
i
ons. We p
l
an to expan
d
re
gi
ona
l
reta
il b
anner square
f
oota
g
et
h
rou
gh
se
l
ect
i
ve new store
g
rowt
h
in ke
y
markets where we have si
g
nificant market share. The Acquisition has si
g
nificantl
y
expanded our retail
presence an
d
t
h
e num
b
er o
f
stores we operate. Save-A-Lot, our
li
m
i
te
d
assortment
f
ormat, current
l
y operates
in
42 states. In a
ddi
t
i
on, we w
ill
supp
l
ement re
gi
ona
l
reta
il
store
g
rowt
h
w
i
t
h
cont
i
nue
df
ocus on remo
d
e
l
act
i
v
i
t
i
es
.
Given the life c
y
cle maturit
y
of our Suppl
y
chain services business with its inherent attrition rate, future
g
rowth
i
n
f
oo
ddi
str
ib
ut
i
on w
ill b
emo
d
est an
d
pr
i
mar
il
yac
hi
eve
d
t
h
roug
h
serv
i
ng new
i
n
d
epen
d
ent customers, net
g
rowt
hf
rom ex
i
st
i
n
g
customers an
df
urt
h
er conso
lid
at
i
on opportun
i
t
i
es.
R
E
S
ULT
S
OF OPERATION
S
H
i
g
hli
g
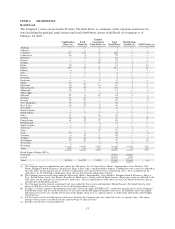
hts of results of operations as reported and as a percent of net sales are as follows
:
February
24,
200
7
(52 weeks
)
February
2
5
,
2006
(52 weeks
)
February
26
,
2005
(52 weeks
)
(
In milli
o
n
s)
(os)
%
Net sales $37,406 100.0% $19,864 100.0% $19,543 100.0
C
ost of sales 29,267 78.2 16,977 85.5 16,681 85.
4
Selling and administrative expenses
6
,834 18.3 2,448 12.3 2,229 11.
4
Gain on sale of WinCo Foods
,
Inc. — — — — 109 0.6
R
estructure and other char
g
es — — 4 — 26 0.1
Operatin
g
earnin
g
s $ 1,305 3.5 $ 435 2.2 $ 716 3.7
I
nterest expense
6
00 1.
6
139 0.7 138 0.7
I
nterest
i
ncome 42
0
.1
33 0
.2 2
30
.1
Earnings before income taxes
$
747 2.0
$
329 1.7
$
601 3.1
I
ncome tax ex
p
ense 29
5
0.8 123 0.6 21
5
1.1
%
Net earnin
g
s $ 452 1.2% $ 206 1.1% $ 386 2.0
Net earnin
g
s per common share – diluted $ 2.32 $ 1.46 $ 2.7
1
Comparison of fifty-two weeks ended February 24, 2007
(
fiscal 2007
)
with fifty-two weeks ende
d
Februar
y
25, 2006 (fiscal 2006):
I
n fiscal 2007, the Company achieved net sales of
$
37,406 compared with
$
19,864 last year. Net earnings for
f
iscal 2007 were $452 and diluted earnin
g
s per share were $2.32 compared with net earnin
g
s of $206 and diluted
earnings per share of
$
1.46 last year. Results for fiscal 2007 include Acquisition-related costs (defined a
s
o
ne-time transaction costs, which primarily include retention bonuses and consultant fees) of
$
40 after tax,
char
g
es related to the Compan
y
’s plan to dispose of 18 Scott’s banner stores (“Scott’s”) of $23 after tax an
d
i
ncrementa
l
stoc
k
opt
i
on expense re
l
ate
d
to t
h
e Company’s a
d
opt
i
on o
f
Statement o
f
F
i
nanc
i
a
l
Account
i
n
g
Standards (“SFAS”) No. 123 (Revised 2004), “Share Based Payment” (“SFAS No. 123(R)”) of $15 after tax
.
R
esults for fiscal 2006 included char
g
es of $111 after tax primaril
y
related to Chica
g
o and Pittsbur
g
h.
21