Albertsons 2007 Annual Report Download - page 104
Download and view the complete annual report
Please find page 104 of the 2007 Albertsons annual report below. You can navigate through the pages in the report by either clicking on the pages listed below, or by using the keyword search tool below to find specific information within the annual report.-
 1
1 -
2
-
3
-
4
-
5
-
6
-
7
-
8
-
9
-
10
-
11
-
12
-
13
-
14
-
15
-
16
-
17
-
18
-
19
-
20
-
21
-
22
-
23
-
24
-
25
-
26
-
27
-
28
-
29
-
30
-
31
-
32
-
33
-
34
-
35
-
36
-
37
-
38
-
39
-
40
-
41
-
42
-
43
-
44
-
45
-
46
-
47
-
48
-
49
-
50
-
51
-
52
-
53
-
54
-
55
-
56
-
57
-
58
-
59
-
60
-
61
-
62
-
63
-
64
-
65
-
66
-
67
-
68
-
69
-
70
-
71
-
72
-
73
-
74
-
75
-
76
-
77
-
78
-
79
-
80
-
81
-
82
-
83
-
84
-
85
-
86
-
87
-
88
-
89
-
90
-
91
-
92
-
93
-
 94
94 -
 95
95 -
 96
96 -
 97
97 -
 98
98 -
 99
99 -
 100
100 -
 101
101 -
 102
102 -
 103
103 -
 104
104 -
 105
105 -
 106
106 -
 107
107 -
 108
108 -
 109
109 -
 110
110 -
 111
111 -
 112
112 -
 113
113 -
 114
114 -
115
-
116
-
117
-
118
-
119
-
120
-
121
-
122
-
123
-
124
 |
 |

SU
PERVAL
U
IN
C
. and
S
ubsidiaries
N
OTES TO CONSOLIDATED FINANCIAL STATEMENTS—(Continued)
F
ebruar
y
26, 2005 was $71, $29 and $41, respectivel
y
. Intrinsic value is measured usin
g
the fair market value at
the date of exercise for stock options exercised or at February 24, 2007 for outstanding stock options, less the
a
pp
li
ca
bl
e exerc
i
se pr
i
ce
.
F
or stock options, the fair value of each option
g
rant is estimated as of the date of
g
rant usin
g
the Black-Scholes
o
ption pricing model. Expected volatilities are estimated based on an average of actual historical volatility and
i
mp
li
e
d
vo
l
at
ili
t
i
es correspon
di
ng to t
h
e opt
i
ons est
i
mate
d
expecte
d
term. T
h
e Company
b
e
li
eves t
hi
s approac
h
to determine volatilities is re
p
resentative of future stock volatilities. The ex
p
ected term of o
p
tions are estimated
b
ased on analysis of options already exercised and foreseeable trends or changes in behavior. The risk fre
e
i
nterest rates are
b
ase
d
on t
h
e U.S. Treasury secur
i
t
i
es matur
i
t
i
es as o
f
eac
h
app
li
ca
bl
e grant
d
ate. T
h
e
di
v
id
en
d
y
ield is based on anal
y
sis of actual historical dividend
y
ields
.
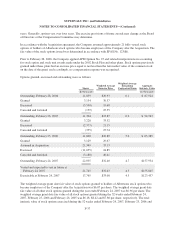
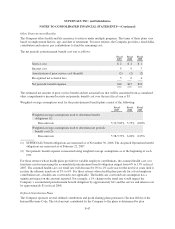
T
he significant weighted average assumptions relating to the valuation of the Company’s stock options for th
e
52-week periods ended February 24, 2007 and February 25, 2006 were as follows:
52 Weeks Ende
d
Februar
y
24,
2
00
7
F
ebruar
y
25
,
2
006
Februar
y
26
,
2
005
Di
v
id
en
d
y
i
e
ld
2.0% 2.0% 2.0%
V
olatility rate 20.6 - 29.
5
% 28.9% 31.8%
R
isk-free interest rate 4.
5
-
5
.2% 3.9% 3.1%
Expected option life (
y
ears) 1.0 -
5
.4
y
ears 4.8
y
ears 4.
5y
ears
Com
p
ensation Ex
p
ens
e
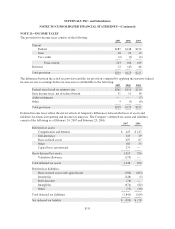
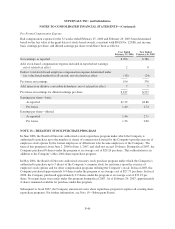
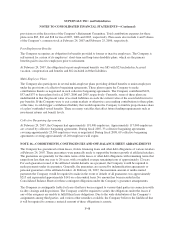
T
he components of pre-tax stock-based compensation expense (included primaril
y
in Sellin
g
and administrativ
e
expenses in the Consolidated Statement of Earnings) and related tax benefits were as follows
:
52
Weeks Ended
February 24,
2007
F
ebruary 25
,
2006
February 26,
200
5
S
tock-based com
p
ensation
$
43
$
3
$
1
2
Income tax benefits (17) (1) (4)
S
tock-based compensation (net of tax) $ 26 $ 2 $ 8
T
he Company realized excess tax benefits of
$
22 related to the exercise of stock options
.
Unrecognized Compensation Expens
e
S
toc
k
O
p
tions
As of Februar
y
24, 2007, there was $27 of unreco
g
nized compensation expense related to nonvested option
s
g
ranted under the Company’s stock-based compensation plans. The expense related to these nonvested awards i
s
expecte
d
to
b
ec
h
arge
d
to expense over a we
i
g
h
te
d
-average rema
i
n
i
ng vest
i
ng per
i
o
d
o
f
approx
i
mate
l
y two years.
Option shares available for
g
rant were 17 and 10 at Februar
y
24, 2007 and Februar
y
2
5
, 2006, respectivel
y
.Asof
February 24, 2007, the Company has reserved 40 shares, in aggregate, for the plans.
F-
38