Albertsons 2007 Annual Report Download - page 25
Download and view the complete annual report
Please find page 25 of the 2007 Albertsons annual report below. You can navigate through the pages in the report by either clicking on the pages listed below, or by using the keyword search tool below to find specific information within the annual report.-
 1
1 -
2
-
3
-
4
-
5
-
6
-
7
-
8
-
9
-
10
-
11
-
12
-
13
-
14
-
 15
15 -
 16
16 -
 17
17 -
 18
18 -
 19
19 -
 20
20 -
 21
21 -
 22
22 -
 23
23 -
 24
24 -
 25
25 -
 26
26 -
 27
27 -
 28
28 -
 29
29 -
 30
30 -
 31
31 -
 32
32 -
 33
33 -
 34
34 -
 35
35 -
36
-
37
-
38
-
39
-
40
-
41
-
42
-
43
-
44
-
45
-
46
-
47
-
48
-
49
-
50
-
51
-
52
-
53
-
54
-
55
-
56
-
57
-
58
-
59
-
60
-
61
-
62
-
63
-
64
-
65
-
66
-
67
-
68
-
69
-
70
-
71
-
72
-
73
-
74
-
75
-
76
-
77
-
78
-
79
-
80
-
81
-
82
-
83
-
84
-
85
-
86
-
87
-
88
-
89
-
90
-
91
-
92
-
93
-
94
-
95
-
96
-
97
-
98
-
99
-
100
-
101
-
102
-
103
-
104
-
105
-
106
-
107
-
108
-
109
-
110
-
111
-
112
-
113
-
114
-
115
-
116
-
117
-
118
-
119
-
120
-
121
-
122
-
123
-
124
 |
 |
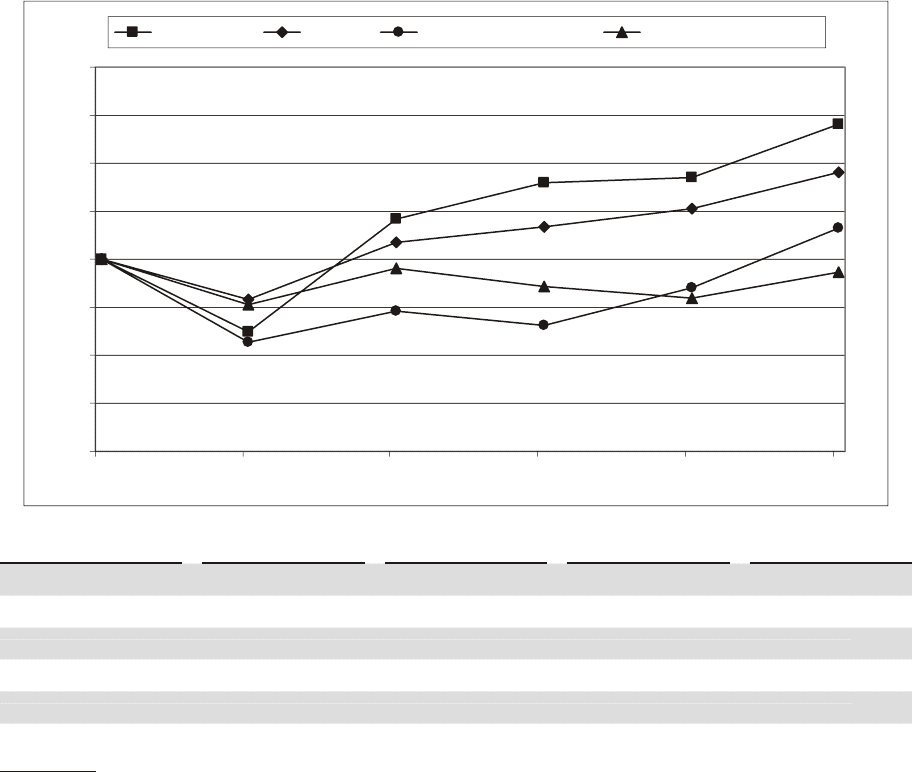
S
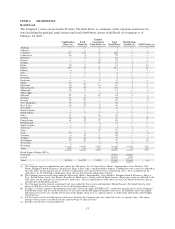
tock Performance Gra
ph
T
he followin
gg
raph compares the
y
earl
y
chan
g
e in the Compan
y
’s cumulative shareholder return on its common
stock for the
p
eriod from the end of fiscal 2002 to the end of fiscal 2007 to that of the Standard & Poor’s
(“S&P”) 500 and a group of peer companies in the retail grocery industry. The stock price performance shown
below is not necessaril
y
indicative of future performance.
COMPARI
S
ON OF FIVE-YEAR TOTAL RETURN AMONG
S
UPERVALU
,S
&P 500
,
FISCAL 2006 PEER GROUP AND FISCAL 2007 PEER GROUP
(
1
)
February 22, 2002 throu
g
h February 23, 2007 (2)
$0
$25
$50
$75
$100
$125
$150
$175
$200
Feb-02 Feb-03 Feb-04 Feb-05 Feb-06 Feb-07
SUPERVALU S&P 500 Fiscal 2006 Peer Group Fiscal 2007 Peer Group
D
at
e
SU
PERVAL
U
S
&P 500
Fi
sca
l 200
6
P
eer Group
(
3
)
Fi
sca
l 200
7
Peer Group
(
4
)
Fe
b
ruary 22, 2002 100.00 100.00 100.00 100.0
0
Februar
y
21, 2003 62.32 79.16
5
6.90 76.66
Februar
y
27, 2004 121.23 108.71 72.92 9
5
.2
1
February 25, 2005 140.10 116.90 65.51 85.5
8
February 24, 2006 142.30 126.60 85.01 80.0
5
February 23, 2007 170.
5
3 144.97 116.41 93.1
4
(1) Total return assumin
g
$100 invested on Februar
y
22, 2002 and reinvestment of dividends on the da
y
the
y
were
p
aid
.
(2) T
h
e Company’s
fi
sca
l
year en
d
sont
h
e
l
ast Satur
d
ay
i
nFe
b
ruary
.
(3) The 200
6
Peer Group consists of Great Atlantic & Pacific Tea Compan
y
, Inc., In
g
les Markets, Incorporated,
T
he Kro
g
er Co., Pathmark Stores, Inc., Safewa
y
Inc. and Weis Markets, Inc.
(4) In
fi
sca
l
2007, t
h
e Company acqu
i
re
d
t
h
e core supermar
k
et
b
us
i
nesses o
f
A
lb
ertsons. T
hi
s acqu
i
s
i
t
i
o
n
g
reatl
y
increased the relative size of the Compan
y
’s Retail food business. As a result, the Compan
y
’s fiscal
2007 Peer Group was revised to consist of Delhaize Group, Great Atlantic & Pacific Tea Compan
y
, Inc.
,
K
on
i
n
klijk
eA
h
o
ld
N.V., T
h
e Kroger Co., Sa
f
eway Inc. an
d
Wa
l
-Mart Stores, Inc
.
19