Albertsons 2007 Annual Report Download - page 29
Download and view the complete annual report
Please find page 29 of the 2007 Albertsons annual report below. You can navigate through the pages in the report by either clicking on the pages listed below, or by using the keyword search tool below to find specific information within the annual report.-
 1
1 -
2
-
3
-
4
-
5
-
6
-
7
-
8
-
9
-
10
-
11
-
12
-
13
-
14
-
15
-
16
-
17
-
18
-
 19
19 -
 20
20 -
 21
21 -
 22
22 -
 23
23 -
 24
24 -
 25
25 -
 26
26 -
 27
27 -
 28
28 -
 29
29 -
 30
30 -
 31
31 -
 32
32 -
 33
33 -
 34
34 -
 35
35 -
 36
36 -
 37
37 -
 38
38 -
 39
39 -
40
-
41
-
42
-
43
-
44
-
45
-
46
-
47
-
48
-
49
-
50
-
51
-
52
-
53
-
54
-
55
-
56
-
57
-
58
-
59
-
60
-
61
-
62
-
63
-
64
-
65
-
66
-
67
-
68
-
69
-
70
-
71
-
72
-
73
-
74
-
75
-
76
-
77
-
78
-
79
-
80
-
81
-
82
-
83
-
84
-
85
-
86
-
87
-
88
-
89
-
90
-
91
-
92
-
93
-
94
-
95
-
96
-
97
-
98
-
99
-
100
-
101
-
102
-
103
-
104
-
105
-
106
-
107
-
108
-
109
-
110
-
111
-
112
-
113
-
114
-
115
-
116
-
117
-
118
-
119
-
120
-
121
-
122
-
123
-
124
 |
 |
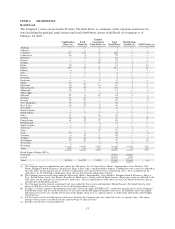
Supply chain services Net sales, compared with last year’s Supply chain services Operating earnings of
$
214, o
r
2.3 percent o
f
Supp
l
yc
h
a
i
n serv
i
ces Net sa
l
es. T
h
e
i
ncrease
i
n Supp
l
yc
h
a
i
n serv
i
ces Operat
i
ng earn
i
ngs, as a
percent of Suppl
y
chain services Net sales, primaril
y
reflects improved sales levera
g
e
.
Net Interest Ex
p
ens
e
Net interest expense was
$
558 in fiscal 2007 compared with
$
106 last year. The increase primarily reflects
i
nterest expense re
l
ate
d
to assume
dd
e
b
tan
d
new
b
orrow
i
ngs re
l
ate
d
to t
h
e Acqu
i
s
i
t
i
on.
I
ncome
T
axe
s
T
he effective tax rates were 39.
5
percent and 37.4 percent in fiscal 2007 and fiscal 2006, respectivel
y
. The
increase is primarily due to the Acquisition and the write-off of non tax-deductible goodwill primarily related t
o
the planned disposition of 18 Scott’s stores in fiscal 2007. The fiscal 200
6
effective tax rate was primaril
y
impacted b
y
the write-off of non tax-deductible
g
oodwill related to the sale of Chica
g
o. Without these items, th
e
effective tax rates would have been 38.6 percent and 37.0 percent for fiscal 2007 and fiscal 2006, respectively
.
Net Earn
i
ng
s
Net earnings were
$
452 for fiscal 2007 compared with Net earnings of
$
206 last year. Results for fiscal 2007
include Acquisition-related costs of $40 after tax, a char
g
e related to plans to dispose of Scott’s of $23 after ta
x
a
nd incremental stock option expense related to the Company’s adoption of SFAS No. 123(R) of
$
15 after tax.
R
esults for fiscal 2006 include charges of
$
111 after tax primarily related to Chicago and Pittsburgh
.
Weighted average basic shares increased to 189 for fiscal 2007 compared with 136 shares last year. Weighte
d
a
verage diluted shares increased to 19
6
for fiscal 2007 compared with 14
6
shares last year. The increase is
primaril
y
due to the shares issued in con
j
unction with the Acquisition on June 2, 200
6.
Com
p
arison of fift
y
-two weeks ended Februar
y
25, 2006
(
fiscal 2006
)
with fift
y
-two weeks ende
d
February 26, 2005
(
fiscal 2005
)
:
I
n fiscal 2006, the Company achieved Net sales of
$
19,864 compared with
$
19,543 in fiscal 2005, an increase of
1.6 percent. Net earnin
g
s for fiscal 2006 were $206 compared with Net earnin
g
s of $386 in fiscal 2005. Results
f
or fiscal 2006 include charges of
$
111 after tax primarily related to Chicago and Pittsburgh. Results for fisca
l
2005 include a net after-tax gain on the sale of the Company’s minority interest in WinCo Foods, Inc. (“WinCo”)
o
f $68.
Net
S
ales
Net sales for fiscal 2006 were
$
19,864 com
p
ared with
$
19,543 in fiscal 2005. Retail food sales were
a
pproximately 54 percent of Net sales and Supply chain services sales were approximately 46 percent of Net
sales for each of fiscal 2006 and fiscal 200
5
.
R
etail food sales for fiscal 2006 were
$
10,635 compared to
$
10,549 in fiscal 2005, an increase of 0.8 percent
.
T
he increase primaril
y
reflects net new store
g
rowth, which was partiall
y
offset b
y
ne
g
ative same store sales. For
f
iscal 2006, same-store retail sales, defined as stores operating for four full quarters, including store expansions,
d
ecreased 0.5 percent compared to fiscal 2005.
Fiscal 2006 store activity, including licensed units, resulted in 68 new stores opened and 8
5
stores closed.
Exc
l
us
i
ve o
f
t
h
eC
hi
cago, P
i
tts
b
urg
h
an
d
Dea
l
s stores, tota
l
reta
il
square
f
ootage,
i
nc
l
u
di
ng
li
cense
d
stores,
increased approximatel
y
two percent over the prior
y
ear.
23