Albertsons 2007 Annual Report Download - page 28
Download and view the complete annual report
Please find page 28 of the 2007 Albertsons annual report below. You can navigate through the pages in the report by either clicking on the pages listed below, or by using the keyword search tool below to find specific information within the annual report.Net
S
ales
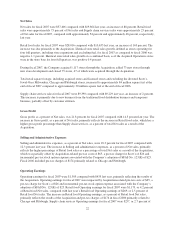
Net sales for fiscal 2007 were $37,406 compared with $19,864 last
y
ear, an increase of 88 percent. Retail food
sales were approximatel
y
7
5
percent of Net sales and Suppl
y
chain services sales were approximatel
y
2
5
percen
t
o
f Net sales for fiscal 2007, compared with approximately 54 percent and approximately 46 percent, respectively
,
l
ast
y
ear.
R
etail food sales for fiscal 2007 were $28,016 compared with $10,635 last
y
ear, an increase of 163 percent. Th
e
i
ncrease was
d
ue pr
i
mar
il
ytot
h
e Acqu
i
s
i
t
i
on. I
d
ent
i
ca
l
store reta
il
sa
l
es growt
h
,
d
e
fi
ne
d
as stores operat
i
ng
f
o
r
f
our full quarters, includin
g
store expansions and excludin
g
fuel, for fiscal 2007 as compared to fiscal 200
6
was
ne
g
ative 1.1 percent. Identical store retail sales
g
rowth on a combined basis, as if the Acquired Operations stores
were
i
nt
h
e store
b
ase
f
or
f
our
f
u
ll
quarters, was pos
i
t
i
ve 0.4 percent
.
Dur
i
n
gfi
sca
l
2007, t
h
e Compan
y
acqu
i
re
d
1,117 stores t
h
rou
gh
t
h
e Acqu
i
s
i
t
i
on, a
dd
e
d
73 new stores t
h
rou
gh
new store development and closed 7
5
stores, 47 of which were acquired throu
g
h the Acquisition
.
T
ota
l
reta
il
square
f
ootage,
i
nc
l
u
di
ng acqu
i
re
d
stores an
dli
cense
d
stores an
d
exc
l
u
di
ng t
h
e
di
veste
d
Scott’s,
J
ewe
l
-Osco M
il
wau
k
ee, C
hi
ca
g
oan
d
P
i
tts
b
ur
gh
stores,
i
ncrease
d
to approx
i
mate
ly
84 m
illi
on square
f
eet at t
h
e
end of fiscal 2007 compared to approximatel
y
30 million square feet at the end of fiscal 2006.
Supply chain services sales for fiscal 2007 were
$
9,390 compared with
$
9,229 last year, an increase of 2 percent.
Thi
s
i
ncrease
i
spr
i
mar
ily d
ue to new
b
us
i
ness
f
rom t
h
e tra
di
t
i
ona
lf
oo
ddi
str
ib
ut
i
on
b
us
i
ness an
d
temporar
y
business, partiall
y
offset b
y
customer attrition.
G
ross Pro
fit
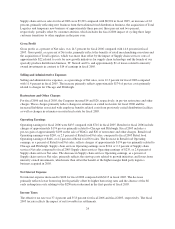
Gross profit, as a percent of Net sales, was 21.8 percent for fiscal 2007 compared with 14.
5
percent last year. The
i
ncrease
i
n Gross pro
fi
t, as a percent o
f
Net sa
l
es, pr
i
mar
il
yre
fl
ects t
h
e
i
ncrease
i
n Reta
il f
oo
d
sa
l
es, w
hi
c
hh
as
a
h
i
g
her
g
ross profit percenta
g
e than Suppl
y
chain services, as a percent of total Net sales as a result of th
e
Ac
q
uisition
.
S
elling and Administrative Expense
s
Se
lli
ng an
d
a
d
m
i
n
i
strat
i
ve expenses, as a percent o
f
Net sa
l
es, were 18.3 percent
f
or
fi
sca
l
2007 compare
d
w
i
t
h
12.3 percent
l
ast year. T
h
e
i
ncrease
i
nSe
lli
ng an
d
a
d
m
i
n
i
strat
i
ve expenses, as a percent o
f
Net sa
l
es, pr
i
mar
ily
reflects the hi
g
her percenta
g
e of Retail food sales as a percenta
g
e of total Net sales as a result of the Acquisition,
which was partially offset by Acquisition-related pre-tax costs of
$
65, a pre-tax charge for Scott’s of
$
26 and
incremental pre-tax stock option expense associated with the Company’s adoption of SFAS No. 123(R) of
$
25.
Fiscal 2006 included pre-tax char
g
es of $174 primaril
y
related to Chica
g
o and Pittsbur
g
h
.
O
perat
i
ng Earn
i
ngs
Operatin
g
earnin
g
s for fiscal 2007 were $1,305 compared with $435 last
y
ear, primaril
y
reflectin
g
the results o
f
the Acquisition. Operating earnings for fiscal 2007 were impacted by Acquisition-related pre-tax costs of
$
65,
a
pre-tax char
g
e for Scott’s of $26 and incremental pre-tax stock option expense associated with the Compan
y
’
s
a
doption of SFAS No. 123(R) of $25. Retail food Operatin
g
earnin
g
s for fiscal 2007 were $1,179, or 4.2 percent
o
f Retail food Net sales, compared with last year’s Retail food Operating earnings of
$
269, or 2.5 percent o
f
R
eta
il f
oo
d
Net sa
l
es. T
h
e
i
ncrease
i
n Reta
il f
oo
d
Operat
i
n
g
earn
i
n
g
s, as a percent o
f
Reta
il f
oo
d
Net sa
l
es
,
primaril
y
reflects the results of the Acquisition and pre-tax char
g
es of $174 in fiscal 2006 primaril
y
related t
o
C
hicago and Pittsburgh. Supply chain services Operating earnings for fiscal 2007 were
$
257, or 2.7 percent of
22


