Albertsons 2007 Annual Report Download - page 72
Download and view the complete annual report
Please find page 72 of the 2007 Albertsons annual report below. You can navigate through the pages in the report by either clicking on the pages listed below, or by using the keyword search tool below to find specific information within the annual report.-
 1
1 -
2
-
3
-
4
-
5
-
6
-
7
-
8
-
9
-
10
-
11
-
12
-
13
-
14
-
15
-
16
-
17
-
18
-
19
-
20
-
21
-
22
-
23
-
24
-
25
-
26
-
27
-
28
-
29
-
30
-
31
-
32
-
33
-
34
-
35
-
36
-
37
-
38
-
39
-
40
-
41
-
42
-
43
-
44
-
45
-
46
-
47
-
48
-
49
-
50
-
51
-
52
-
53
-
54
-
55
-
56
-
57
-
58
-
59
-
60
-
61
-
 62
62 -
 63
63 -
 64
64 -
 65
65 -
 66
66 -
 67
67 -
 68
68 -
 69
69 -
 70
70 -
 71
71 -
 72
72 -
 73
73 -
 74
74 -
 75
75 -
 76
76 -
 77
77 -
 78
78 -
 79
79 -
 80
80 -
 81
81 -
 82
82 -
83
-
84
-
85
-
86
-
87
-
88
-
89
-
90
-
91
-
92
-
93
-
94
-
95
-
96
-
97
-
98
-
99
-
100
-
101
-
102
-
103
-
104
-
105
-
106
-
107
-
108
-
109
-
110
-
111
-
112
-
113
-
114
-
115
-
116
-
117
-
118
-
119
-
120
-
121
-
122
-
123
-
124
 |
 |

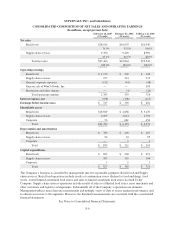
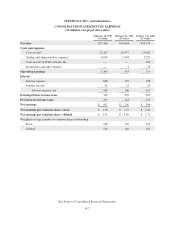
SU
PERVAL
U
IN
C
. and
S
ubsidiaries
CO
N
SO
LIDATED
CO
MP
OS
ITI
O
N
O
F NET
S
ALE
S
AND
O
PERATIN
G
EARNIN
GS
(
In millions, exce
p
t
p
ercent data
)
F
ebruary
24
,
200
7
(
52 weeks)
F
ebruary
2
5,
2006
(
52 weeks)
F
ebruary
26
,
200
5
(
52 weeks)
N
et sales
R
etail food $28
,
016 $10
,
635 $10
,
54
9
74.
9
%
5
3.
5
%
5
4.0
%
Supp
l
yc
h
a
i
n serv
i
ces 9,390 9,229 8,99
4
25
.1% 4
6
.
5
%4
6
.
0%
T
otal net sales $37,406 $19,864 $19,543
100
.
0% 100
.
0% 100
.
0%
O
perat
i
ng earn
i
ngs
R
etail food $ 1,179 $ 269 $ 44
6
Suppl
y
chain services 257 214 235
G
enera
l
corporate expenses (131) (44) (48)
G
ain on sale of WinCo Foods
,
Inc. — — 109
R
estructure and other char
g
es — (4) (2
6
)
T
otal operating earnings 1,305 435 716
I
nterest ex
p
ense, net
(55
8) (106) (11
5
)
E
arnings before income taxe
s
$
747
$
329
$
60
1
Ide
nt
ifiab
l
e asse
t
s
R
etail food
$
18,949
$
2,858
$
3,270
Supply chain services 2,697 2,614 2,55
0
Cor
p
orate
5
6 681 4
5
4
T
otal $21
,
702 $ 6
,
153 $ 6
,
27
4
Deprec
i
at
i
on and amort
i
zat
i
o
n
R
etail food
$
783
$
216
$
20
7
Supply chain services 96 94 95
C
or
p
orate —
11
T
otal
$
879
$
311
$
30
3
C
ap
i
tal expend
i
tures
R
etail food
$
823
$
248
$
219
Supply chain services 103 116 106
Cor
p
orate 1 1
1
T
otal
$
927
$
365
$
326
T
he Company’s business is classified by management into two reportable segments: Retail food and Suppl
y
c
h
a
i
n serv
i
ces. Reta
il f
oo
d
operat
i
ons
i
nc
l
u
d
e resu
l
ts o
f
com
bi
nat
i
on stores (
d
e
fi
ne
d
as
f
oo
d
an
dd
rug),
f
oo
d
stores, owned limited assortment food stores and sales to limited assortment food stores licensed b
y
the
C
ompany. Supply chain services operations include results of sales to affiliated food stores, mass merchants an
d
o
t
h
er customers an
dl
og
i
st
i
cs arrangements. Su
b
stant
i
a
ll
ya
ll
o
f
t
h
e Company’s operat
i
ons are
d
omest
i
c
.
Mana
g
ement utilizes more than one measurement and multiple views of data to assess se
g
ment performance an
d
to allocate resources to the segments. However, the dominant measurements are consistent with the consolidate
d
fi
nanc
i
a
l
statements.
See Notes to Consolidated Financial Statements
.
F-
6