Albertsons 2007 Annual Report Download - page 26
Download and view the complete annual report
Please find page 26 of the 2007 Albertsons annual report below. You can navigate through the pages in the report by either clicking on the pages listed below, or by using the keyword search tool below to find specific information within the annual report.-
 1
1 -
2
-
3
-
4
-
5
-
6
-
7
-
8
-
9
-
10
-
11
-
12
-
13
-
14
-
15
-
 16
16 -
 17
17 -
 18
18 -
 19
19 -
 20
20 -
 21
21 -
 22
22 -
 23
23 -
 24
24 -
 25
25 -
 26
26 -
 27
27 -
 28
28 -
 29
29 -
 30
30 -
 31
31 -
 32
32 -
 33
33 -
 34
34 -
 35
35 -
 36
36 -
37
-
38
-
39
-
40
-
41
-
42
-
43
-
44
-
45
-
46
-
47
-
48
-
49
-
50
-
51
-
52
-
53
-
54
-
55
-
56
-
57
-
58
-
59
-
60
-
61
-
62
-
63
-
64
-
65
-
66
-
67
-
68
-
69
-
70
-
71
-
72
-
73
-
74
-
75
-
76
-
77
-
78
-
79
-
80
-
81
-
82
-
83
-
84
-
85
-
86
-
87
-
88
-
89
-
90
-
91
-
92
-
93
-
94
-
95
-
96
-
97
-
98
-
99
-
100
-
101
-
102
-
103
-
104
-
105
-
106
-
107
-
108
-
109
-
110
-
111
-
112
-
113
-
114
-
115
-
116
-
117
-
118
-
119
-
120
-
121
-
122
-
123
-
124
 |
 |
T
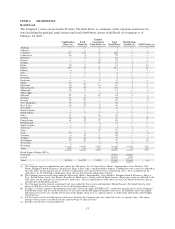
he performance graph above is being furnished solely to accompany this Annual Report on Form 10-K pursuant
to Item 201(e) o
f
Regu
l
at
i
on S-K,
i
s not
b
e
i
ng
fil
e
df
or purposes o
f
Sect
i
on 18 o
f
t
h
e Secur
i
t
i
es Exc
h
ange Act o
f
1934, as amended, and is not to be incorporated b
y
reference into an
y
filin
g
of the Compan
y
, whether made
before or after the date hereof, regardless of any general incorporation language in such filing
.
I
TEM 6.
S
ELE
C
TED FINAN
C
IAL DAT
A
T
he information called for by Item 6 is found within the Five Year Financial and Operating Summary on
pages F-
2
–F-
3
.
I
TEM 7. MANA
G
EMENT’
S
DI
SCUSS
I
O
N AND ANALY
S
I
SO
F FINAN
C
IAL
CO
NDITI
O
N AND
R
E
S
ULT
S
OF OPERATION
S
O
VERVIE
W
SUPERVALU
i
s one o
f
t
h
e
l
ar
g
est
g
rocer
y
compan
i
es
i
nt
h
eUn
i
te
d
States. T
h
e Compan
y
operates
i
n two
se
g
ments of the
g
rocer
y
industr
y
, Retail food stores and Suppl
y
chain services, which includes food distributio
n
a
n
d
re
l
ate
dl
og
i
st
i
cs support serv
i
ces. At Fe
b
ruary 24, 2007, we con
d
ucte
d
our reta
il
operat
i
ons t
h
roug
h
a tota
l
o
f
2,478 stores of which 858 are licensed locations. Store counts are ad
j
usted for the planned sale of 18 Scott’
s
stores and the sale or closure of 10 Jewel-Osco stores in the Milwaukee area. Princi
p
al formats includ
e
com
bi
nat
i
on stores (
d
e
fi
ne
d
as
f
oo
d
an
dd
rug),
f
oo
d
stores an
dli
m
i
te
d
assortment
f
oo
d
stores. Our Supp
l
yc
h
a
i
n
serv
i
ces operat
i
ons networ
k
spans 48 states an
d
we serve as pr
i
mar
yg
rocer
y
supp
li
er to approx
i
mate
ly
2,200
stores, in addition to our own re
g
ional banner store network, as well as servin
g
as secondar
yg
rocer
y
supplier to
a
pprox
i
mate
l
y 400 stores. SUPERVALU
i
s one o
f
t
h
e
l
argest compan
i
es
i
nt
h
eUn
i
tes States grocery c
h
anne
l
.
The Albertsons Ac
q
uisitio
n
On June 2, 200
6
(the “Acquisition Date”), the Company acquired New Albertson’s, Inc. (“New Albertsons”
)
consistin
g
of the core supermarket businesses (the “Acquired Operations”) formerl
y
owned b
y
Albertson’s, Inc
.
(“Albertsons”) operatin
g
under the banners of Acme Markets, Bristol Farms, Jewel-Osco, Shaw’s Supermarkets
,
Star Mar
k
et, t
h
eA
lb
ertsons
b
anner
i
nt
h
e Intermounta
i
n, Nort
h
west an
d
Sout
h
ern Ca
lif
orn
i
a reg
i
ons, t
h
ere
l
ate
d
in-store pharmacies under the Osco and Sav-On banners, 10 distribution centers, certain re
g
ional offices and
certain corporate offices in Boise, Idaho; Glendale, Arizona and Salt Lake Cit
y
, Utah (the “Acquisition”)
.
Th
e Acqu
i
s
i
t
i
on great
l
y
i
ncrease
d
t
h
es
i
ze o
f
t
h
e Company. T
h
e Acqu
i
s
i
t
i
on a
l
so great
l
y
i
ncrease
d
t
h
ere
l
at
i
v
e
size of the Compan
y
’s Retail food se
g
ment compared to its Suppl
y
chain services se
g
ment. In fiscal 2007, 74.9
percent of our Net sales and 90.3 percent of our Operatin
g
earnin
g
s came from our Retail food se
g
ment
,
compared to 53.5 percent and 61.8 percent, respectively, in fiscal 2006. In fiscal 2008, we expect the Company’
s
R
etail food se
g
ment will contribute approximatel
y
80 percent of the Compan
y
’s Net sales
.
T
h
eIn
d
ustr
y
an
d
t
h
e Economic Environment
T
he retail
g
rocer
y
industr
y
can be characterized as one of continued consolidation and rationalization, with the
Acquisition being one of the largest acquisitions in the history of the industry. Grocery retailers also continue t
o
compete aga
i
nst an
i
ncreas
i
ng num
b
er o
f
compet
i
t
i
ve
f
ormats t
h
at are a
ddi
ng square
f
ootage
d
evote
d
to
f
oo
d
an
d
g
roceries such as supercenters, club stores, mass merchandisers, dollar stores, dru
g
stores and other alternat
e
f
ormats
.
Th
e grocery
i
n
d
ustry
i
sa
l
so a
ff
ecte
db
yt
h
e genera
l
econom
i
c env
i
ronment an
di
ts
i
mpact on consumer spen
di
ng
behavior. We would characterize fiscal 2007 as a
y
ear with continued economic
g
rowth, continued hi
g
h fuel
20