eBay 2010 Annual Report Download - page 92
Download and view the complete annual report
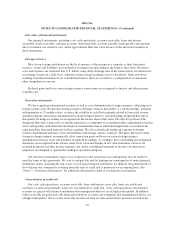
Please find page 92 of the 2010 eBay annual report below. You can navigate through the pages in the report by either clicking on the pages listed below, or by using the keyword search tool below to find specific information within the annual report.-
 1
1 -
2
-
3
-
4
-
5
-
6
-
7
-
8
-
9
-
10
-
11
-
12
-
13
-
14
-
15
-
16
-
17
-
18
-
19
-
20
-
21
-
22
-
23
-
24
-
25
-
26
-
27
-
28
-
29
-
30
-
31
-
32
-
33
-
34
-
35
-
36
-
37
-
38
-
39
-
40
-
41
-
42
-
43
-
44
-
45
-
46
-
47
-
48
-
49
-
50
-
51
-
52
-
53
-
54
-
55
-
56
-
57
-
58
-
59
-
60
-
61
-
62
-
63
-
64
-
65
-
66
-
67
-
68
-
69
-
70
-
71
-
72
-
73
-
74
-
75
-
76
-
77
-
78
-
79
-
80
-
81
-
 82
82 -
 83
83 -
 84
84 -
 85
85 -
 86
86 -
 87
87 -
 88
88 -
 89
89 -
 90
90 -
 91
91 -
 92
92 -
 93
93 -
 94
94 -
 95
95 -
 96
96 -
 97
97 -
 98
98 -
 99
99 -
 100
100 -
 101
101 -
 102
102 -
103
-
104
-
105
-
106
-
107
-
108
-
109
-
110
-
111
-
112
-
113
-
114
-
115
-
116
-
117
-
118
-
119
-
120
-
121
-
122
-
123
-
124
-
125
-
126
-
127
-
128
-
129
-
130
-
131
-
132
-
133
-
134
-
135
-
136
-
137
-
138
-
139
-
140
 |
 |

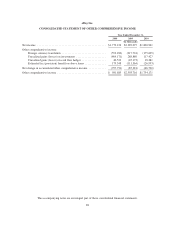
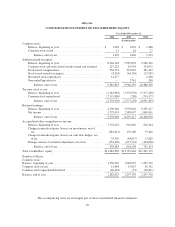
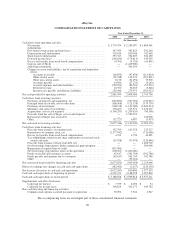
eBay Inc.
CONSOLIDATED STATEMENT OF INCOME
Year Ended December 31,
2008 2009 2010
(In thousands, except per share amounts)
Net revenues ............................................... $8,541,261 $8,727,362 $9,156,274
Cost of net revenues ......................................... 2,228,069 2,479,762 2,564,667
Gross profit ........................................ 6,313,192 6,247,600 6,591,607
Operating expenses:
Sales and marketing ..................................... 1,881,551 1,885,677 1,946,815
Product development ..................................... 725,600 803,070 908,434
General and administrative ................................ 998,871 1,418,389 1,079,383
Provision for transaction and loan losses ..................... 347,453 382,825 392,240
Amortization of acquired intangible assets .................... 234,916 262,686 189,727
Restructuring ........................................... 49,119 38,187 21,437
Total operating expenses .............................. 4,237,510 4,790,834 4,538,036
Income from operations ...................................... 2,075,682 1,456,766 2,053,571
Interest and other income (expense), net .......................... 107,882 1,422,385 44,876
Income before income taxes ................................... 2,183,564 2,879,151 2,098,447
Provision for income taxes .................................... (404,090) (490,054) (297,486)
Net income ................................................ $1,779,474 $2,389,097 $1,800,961
Net income per share:
Basic ................................................. $ 1.37 $ 1.85 $ 1.38
Diluted ................................................ $ 1.36 $ 1.83 $ 1.36
Weighted average shares:
Basic ................................................. 1,303,454 1,289,848 1,305,593
Diluted ................................................ 1,312,608 1,304,981 1,327,417
The accompanying notes are an integral part of these consolidated financial statements.
87