eBay 2010 Annual Report Download - page 59
Download and view the complete annual report
Please find page 59 of the 2010 eBay annual report below. You can navigate through the pages in the report by either clicking on the pages listed below, or by using the keyword search tool below to find specific information within the annual report.-
 1
1 -
2
-
3
-
4
-
5
-
6
-
7
-
8
-
9
-
10
-
11
-
12
-
13
-
14
-
15
-
16
-
17
-
18
-
19
-
20
-
21
-
22
-
23
-
24
-
25
-
26
-
27
-
28
-
29
-
30
-
31
-
32
-
33
-
34
-
35
-
36
-
37
-
38
-
39
-
40
-
41
-
42
-
43
-
44
-
45
-
46
-
47
-
48
-
 49
49 -
 50
50 -
 51
51 -
 52
52 -
 53
53 -
 54
54 -
 55
55 -
 56
56 -
 57
57 -
 58
58 -
 59
59 -
 60
60 -
 61
61 -
 62
62 -
 63
63 -
 64
64 -
 65
65 -
 66
66 -
 67
67 -
 68
68 -
 69
69 -
70
-
71
-
72
-
73
-
74
-
75
-
76
-
77
-
78
-
79
-
80
-
81
-
82
-
83
-
84
-
85
-
86
-
87
-
88
-
89
-
90
-
91
-
92
-
93
-
94
-
95
-
96
-
97
-
98
-
99
-
100
-
101
-
102
-
103
-
104
-
105
-
106
-
107
-
108
-
109
-
110
-
111
-
112
-
113
-
114
-
115
-
116
-
117
-
118
-
119
-
120
-
121
-
122
-
123
-
124
-
125
-
126
-
127
-
128
-
129
-
130
-
131
-
132
-
133
-
134
-
135
-
136
-
137
-
138
-
139
-
140
 |
 |

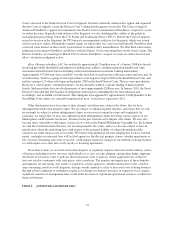
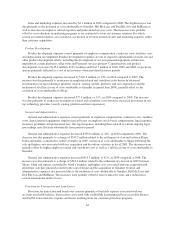
Performance Measurement Comparison
The graph below shows the cumulative total stockholder return of an investment of $100 (and the
reinvestment of any dividends thereafter) on December 30, 2005 (the last trading day for the year ended
December 31, 2005) in (i) our common stock, (ii) the Nasdaq Composite Index, (iii) the S&P 500 Index and
(iv) the S&P North American Technology Internet Index (the successor to the GSTI Internet Index). The S&P
North American Technology Internet Index is a modified-capitalization weighted index representing the Internet
industry, including Internet software and services and Internet retail companies. Our stock price performance
shown in the graph below is not indicative of future stock price performance.
The following graph and related information shall not be deemed “soliciting material” or be deemed to be
“filed” with the SEC, nor shall such information be incorporated by reference into any future filing, except to the
extent that we specifically incorporate it by reference into such filing.
$60.00
$80.00
$100.00
$120.00
$140.00
$160.00
U.S. Dollar
$0.00
$20.00
$40.00
12/31/05 12/31/06 12/31/07 12/31/08 12/31/09 12/31/10
eBay S&P North America Technology Internet Index Nasdaq Composite Index S&P 500 Index
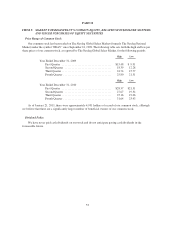
Issuer Purchases of Equity Securities
Stock repurchase activity during the three months ended December 31, 2010 was as follows:
Period
Total Number
of Shares
Purchased
Average
Price Paid
per Share
Total Number of
Shares Purchased
as Part of Publicly
Announced
Programs
Maximum Dollar
Value of Shares
that May Yet be
Purchased Under
the Programs (1)
October 1, 2010—October 31, 2010 ............ — — — $2,356,839,305
November 1, 2010—November 30, 2010 ........ 12,901,324 $30.18 12,901,324 $1,967,413,142
December 1, 2010—December 31, 2010 ........ 798,676 $29.68 798,676 $1,943,707,244
13,700,000 13,700,000
54