eBay 2010 Annual Report Download - page 110
Download and view the complete annual report
Please find page 110 of the 2010 eBay annual report below. You can navigate through the pages in the report by either clicking on the pages listed below, or by using the keyword search tool below to find specific information within the annual report.-
 1
1 -
2
-
3
-
4
-
5
-
6
-
7
-
8
-
9
-
10
-
11
-
12
-
13
-
14
-
15
-
16
-
17
-
18
-
19
-
20
-
21
-
22
-
23
-
24
-
25
-
26
-
27
-
28
-
29
-
30
-
31
-
32
-
33
-
34
-
35
-
36
-
37
-
38
-
39
-
40
-
41
-
42
-
43
-
44
-
45
-
46
-
47
-
48
-
49
-
50
-
51
-
52
-
53
-
54
-
55
-
56
-
57
-
58
-
59
-
60
-
61
-
62
-
63
-
64
-
65
-
66
-
67
-
68
-
69
-
70
-
71
-
72
-
73
-
74
-
75
-
76
-
77
-
78
-
79
-
80
-
81
-
82
-
83
-
84
-
85
-
86
-
87
-
88
-
89
-
90
-
91
-
92
-
93
-
94
-
95
-
96
-
97
-
98
-
99
-
 100
100 -
 101
101 -
 102
102 -
 103
103 -
 104
104 -
 105
105 -
 106
106 -
 107
107 -
 108
108 -
 109
109 -
 110
110 -
 111
111 -
 112
112 -
 113
113 -
 114
114 -
 115
115 -
 116
116 -
 117
117 -
 118
118 -
 119
119 -
 120
120 -
121
-
122
-
123
-
124
-
125
-
126
-
127
-
128
-
129
-
130
-
131
-
132
-
133
-
134
-
135
-
136
-
137
-
138
-
139
-
140
 |
 |

eBay Inc.
NOTES TO CONSOLIDATED FINANCIAL STATEMENTS—(Continued)
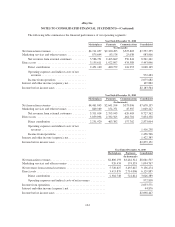
Direct contribution consists of net revenues from external customers less direct costs. Direct costs include
specific costs of net revenues, sales and marketing expenses, and general and administrative expenses, such as
advertising and marketing programs, customer support expenses, bank charges, internal interest charges related
to Bill Me Later, site operations expenses, product development expenses, billing operations, certain technology
and facilities expenses, transaction expenses and provision for transaction and loan losses. Expenses such as our
corporate center costs (consisting of certain costs such as corporate management, human resources, finance and
legal), amortization of intangible assets, restructuring charges and stock-based compensation expense are
excluded from direct costs as they are not included in the measurement of segment performance.
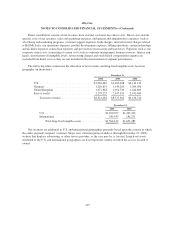
The following tables summarize the allocation of net revenues and long-lived tangible assets based on
geography (in thousands):
December 31,
2008 2009 2010
U.S. ................................... $3,969,482 $3,985,068 $4,214,215
Germany ............................... 1,220,691 1,140,205 1,204,056
United Kingdom ......................... 1,072,863 1,054,730 1,266,603
Rest of world ............................ 2,278,225 2,547,359 2,471,400
Total net revenues .................... $8,541,261 $8,727,362 $9,156,274
December 31,
2009 2010
U.S. ....................................... $1,220,977 $1,465,234
International ................................ 345,435 186,251
Total long-lived tangible assets .............. $1,566,412 $1,651,485
Net revenues are attributed to U.S. and international geographies primarily based upon the country in which
the seller, payment recipient, customer, Skype user’s Internet protocol address (through November 19, 2009),
website that displays advertising, or other service provider, as the case may be, is located. Long-lived assets
attributed to the U.S. and international geographies are based upon the country in which the asset is located or
owned.
105