eBay 2010 Annual Report Download - page 114
Download and view the complete annual report
Please find page 114 of the 2010 eBay annual report below. You can navigate through the pages in the report by either clicking on the pages listed below, or by using the keyword search tool below to find specific information within the annual report.-
 1
1 -
2
-
3
-
4
-
5
-
6
-
7
-
8
-
9
-
10
-
11
-
12
-
13
-
14
-
15
-
16
-
17
-
18
-
19
-
20
-
21
-
22
-
23
-
24
-
25
-
26
-
27
-
28
-
29
-
30
-
31
-
32
-
33
-
34
-
35
-
36
-
37
-
38
-
39
-
40
-
41
-
42
-
43
-
44
-
45
-
46
-
47
-
48
-
49
-
50
-
51
-
52
-
53
-
54
-
55
-
56
-
57
-
58
-
59
-
60
-
61
-
62
-
63
-
64
-
65
-
66
-
67
-
68
-
69
-
70
-
71
-
72
-
73
-
74
-
75
-
76
-
77
-
78
-
79
-
80
-
81
-
82
-
83
-
84
-
85
-
86
-
87
-
88
-
89
-
90
-
91
-
92
-
93
-
94
-
95
-
96
-
97
-
98
-
99
-
100
-
101
-
102
-
103
-
 104
104 -
 105
105 -
 106
106 -
 107
107 -
 108
108 -
 109
109 -
 110
110 -
 111
111 -
 112
112 -
 113
113 -
 114
114 -
 115
115 -
 116
116 -
 117
117 -
 118
118 -
 119
119 -
 120
120 -
 121
121 -
 122
122 -
 123
123 -
 124
124 -
125
-
126
-
127
-
128
-
129
-
130
-
131
-
132
-
133
-
134
-
135
-
136
-
137
-
138
-
139
-
140
 |
 |

eBay Inc.
NOTES TO CONSOLIDATED FINANCIAL STATEMENTS—(Continued)
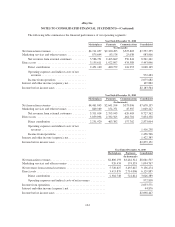
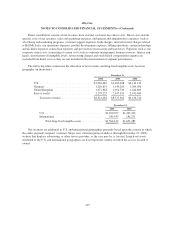
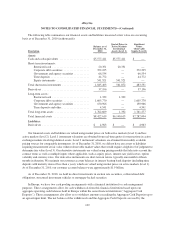
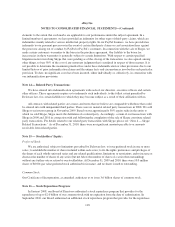
The following table summarizes our financial assets and liabilities measured at fair value on a recurring
basis as of December 31, 2010 (in thousands):
Description
Balance as of
December 31,
2010
Quoted Prices in
Active Markets
for Identical
Assets (Level 1)
Significant
Other
Observable
Inputs (Level 2)
Assets:
Cash and cash equivalents ..................... $5,577,411 $5,577,411 $ —
Short-term investments:
Restricted cash .......................... 20,351 20,351 —
Corporate debt securities .................. 372,225 — 372,225
Government and agency securities ........... 66,534 — 66,534
Time deposits ........................... 44,772 — 44,772
Equity instruments ....................... 541,521 541,521 —
Total short-term investments ................... 1,045,403 561,872 483,531
Derivatives ................................. 37,196 — 37,196
Long-term assets:
Restricted cash .......................... 1,332 1,332 —
Corporate debt securities .................. 1,605,770 — 1,605,770
Government and agency securities ........... 150,966 — 150,966
Time deposits and other ................... 4,541 — 4,541
Total long-term assets ........................ 1,762,609 1,332 1,761,277
Total financial assets ......................... $8,422,619 $6,140,615 $2,282,004
Liabilities:
Derivatives ................................. $ 4,963 $ — $ 4,963
Our financial assets and liabilities are valued using market prices on both active markets (level 1) and less
active markets (level 2). Level 1 instrument valuations are obtained from real-time quotes for transactions in active
exchange markets involving identical assets. Level 2 instrument valuations are obtained from readily available
pricing sources for comparable instruments. As of December 31, 2010, we did not have any assets or liabilities
requiring measurement at fair value without observable market values that would require a high level of judgment to
determine fair value (level 3). Our derivative instruments are valued using pricing models that take into account the
contract terms as well as multiple inputs where applicable, such as equity prices, interest rate yield curves, option
volatility and currency rates. Our derivative instruments are short-term in nature, typically one month to fifteen
months in duration. We maintain our customer account balances in interest bearing bank deposits (including time
deposits with maturity dates of less than a year), which are valued using market prices on active markets (level 1).
As of December 31, 2010, our customer account balances were approximately $1.9 billion.
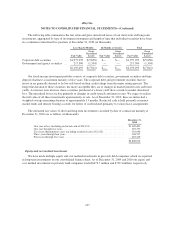
As of December 31, 2010, we held no direct investments in auction rate securities, collateralized debt
obligations, structured investment vehicles or mortgage-backed securities.
In Europe, we have two cash pooling arrangements with a financial institution for cash management
purposes. These arrangements allow for cash withdrawals from this financial institution based upon our
aggregate operating cash balances held in Europe within the same financial institution (“Aggregate Cash
Deposits”). These arrangements also allow us to withdraw amounts exceeding the Aggregate Cash Deposits up to
an agreed-upon limit. The net balance of the withdrawals and the Aggregate Cash Deposits are used by the
109