eBay 2010 Annual Report Download - page 108
Download and view the complete annual report
Please find page 108 of the 2010 eBay annual report below. You can navigate through the pages in the report by either clicking on the pages listed below, or by using the keyword search tool below to find specific information within the annual report.-
 1
1 -
2
-
3
-
4
-
5
-
6
-
7
-
8
-
9
-
10
-
11
-
12
-
13
-
14
-
15
-
16
-
17
-
18
-
19
-
20
-
21
-
22
-
23
-
24
-
25
-
26
-
27
-
28
-
29
-
30
-
31
-
32
-
33
-
34
-
35
-
36
-
37
-
38
-
39
-
40
-
41
-
42
-
43
-
44
-
45
-
46
-
47
-
48
-
49
-
50
-
51
-
52
-
53
-
54
-
55
-
56
-
57
-
58
-
59
-
60
-
61
-
62
-
63
-
64
-
65
-
66
-
67
-
68
-
69
-
70
-
71
-
72
-
73
-
74
-
75
-
76
-
77
-
78
-
79
-
80
-
81
-
82
-
83
-
84
-
85
-
86
-
87
-
88
-
89
-
90
-
91
-
92
-
93
-
94
-
95
-
96
-
97
-
 98
98 -
 99
99 -
 100
100 -
 101
101 -
 102
102 -
 103
103 -
 104
104 -
 105
105 -
 106
106 -
 107
107 -
 108
108 -
 109
109 -
 110
110 -
 111
111 -
 112
112 -
 113
113 -
 114
114 -
 115
115 -
 116
116 -
 117
117 -
 118
118 -
119
-
120
-
121
-
122
-
123
-
124
-
125
-
126
-
127
-
128
-
129
-
130
-
131
-
132
-
133
-
134
-
135
-
136
-
137
-
138
-
139
-
140
 |
 |

eBay Inc.
NOTES TO CONSOLIDATED FINANCIAL STATEMENTS—(Continued)
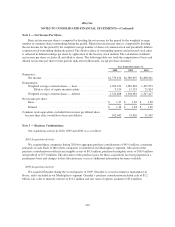
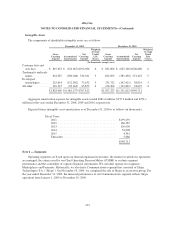
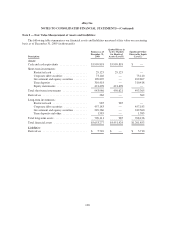
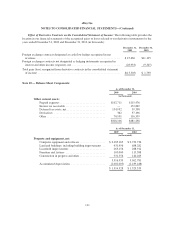
Intangible Assets
The components of identifiable intangible assets are as follows:
December 31, 2009 December 31, 2010
Gross
Carrying
Amount
Accumulated
Amortization
Net
Carrying
Amount
Weighted
Average
Useful
Life
(Years)
Gross
Carrying
Amount
Accumulated
Amortization
Net
Carrying
Amount
Weighted
Average
Useful
Life
(Years)
(In thousands, except years)
Customer lists and
user base ........ $ 819,653 $ (524,667) $294,986 6 $ 831,806 $ (625,126) $206,680 6
Trademarks and trade
names .......... 634,387 (300,046) 334,341 5 632,899 (381,456) 251,443 5
Developed
technologies ..... 225,614 (152,982) 72,632 3 231,312 (192,421) 38,891 3
All other .......... 149,315 (83,462) 65,853 4 156,306 (112,609) 43,697 4
$1,828,969 $(1,061,157) $767,812 $1,852,323 $(1,311,612) $540,711
Aggregate amortization expense for intangible assets totaled $281.6 million, $337.5 million and $254.1
million for the years ended December 31, 2008, 2009 and 2010, respectively.
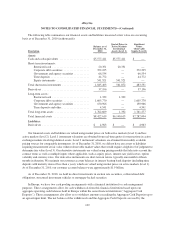
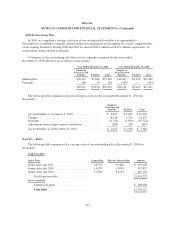
Expected future intangible asset amortization as of December 31, 2010 is as follows (in thousands):
Fiscal Years:
2011 ........................................ $199,259
2012 ........................................ 160,387
2013 ........................................ 130,990
2014 ........................................ 39,808
2015 ........................................ 4,381
Thereafter .................................... 5,886
$540,711
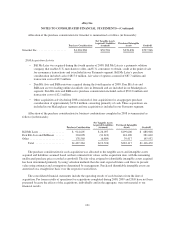
Note 6 — Segments:
Operating segments are based upon our internal organization structure, the manner in which our operations
are managed, the criteria used by our Chief Operating Decision Maker (CODM) to evaluate segment
performance and the availability of separate financial information. We currently operate two segments:
Marketplaces and Payments. Historically, we also had a Communications segment that consisted of Skype
Technologies S.A. (“Skype”). On November 19, 2009, we completed the sale of Skype to an investor group. For
the year ended December 31, 2009, the financial performance of our Communications segment reflects Skype
operations from January 1, 2009 to November 19, 2009.
103