eBay 2010 Annual Report Download - page 7
Download and view the complete annual report
Please find page 7 of the 2010 eBay annual report below. You can navigate through the pages in the report by either clicking on the pages listed below, or by using the keyword search tool below to find specific information within the annual report.-
 1
1 -
 2
2 -
 3
3 -
 4
4 -
 5
5 -
 6
6 -
 7
7 -
 8
8 -
 9
9 -
 10
10 -
 11
11 -
 12
12 -
 13
13 -
 14
14 -
 15
15 -
 16
16 -
 17
17 -
 18
18 -
19
-
20
-
21
-
22
-
23
-
24
-
25
-
26
-
27
-
28
-
29
-
30
-
31
-
32
-
33
-
34
-
35
-
36
-
37
-
38
-
39
-
40
-
41
-
42
-
43
-
44
-
45
-
46
-
47
-
48
-
49
-
50
-
51
-
52
-
53
-
54
-
55
-
56
-
57
-
58
-
59
-
60
-
61
-
62
-
63
-
64
-
65
-
66
-
67
-
68
-
69
-
70
-
71
-
72
-
73
-
74
-
75
-
76
-
77
-
78
-
79
-
80
-
81
-
82
-
83
-
84
-
85
-
86
-
87
-
88
-
89
-
90
-
91
-
92
-
93
-
94
-
95
-
96
-
97
-
98
-
99
-
100
-
101
-
102
-
103
-
104
-
105
-
106
-
107
-
108
-
109
-
110
-
111
-
112
-
113
-
114
-
115
-
116
-
117
-
118
-
119
-
120
-
121
-
122
-
123
-
124
-
125
-
126
-
127
-
128
-
129
-
130
-
131
-
132
-
133
-
134
-
135
-
136
-
137
-
138
-
139
-
140
 |
 |

payment processing services and, until the sale of Skype on November 19, 2009, fees charged to users to connect
Skype’s Internet communications products to traditional fixed-line and mobile telephones. Our marketing
services revenues are derived principally from the sale of advertisements, revenue sharing arrangements,
classifieds fees and lead referral fees. Our other revenues are derived principally from interest earned on certain
PayPal customer account balances, interest and fees earned on the Bill Me Later portfolio of receivables from
loans and from contractual arrangements with third parties that provide services to our users.
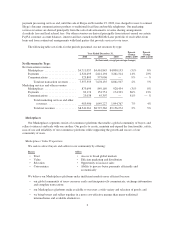
The following table sets forth, for the periods presented, our net revenues by type:
Year Ended December 31, Percent
Change
2008 to 2009
Percent
Change
2009 to 20102008 2009 2010
(In thousands, except percentage changes)
Net Revenues by Type:
Net transaction revenues
Marketplaces ...................... $4,711,057 $4,461,845 $4,800,193 (5)% 8%
Payments ......................... 2,320,495 2,641,194 3,261,314 14% 23%
Communications ................... 525,803 575,096 — 9% — %
Total net transaction revenues ..... 7,557,355 7,678,135 8,061,507 2% 5%
Marketing services and other revenues
Marketplaces ...................... 875,694 849,169 920,434 (3)% 8%
Payments ......................... 83,174 154,751 174,333 86% 13%
Communications ................... 25,038 45,307 — 81% — %
Total marketing services and other
revenues .................... 983,906 1,049,227 1,094,767 7% 4%
Total net revenues .............. $8,541,261 $8,727,362 $9,156,274 2% 5%
Marketplaces
Our Marketplaces segment consists of ecommerce platforms that enable a global community of buyers and
sellers to interact and trade with one another. Our goal is to create, maintain and expand the functionality, safety,
ease-of-use and reliability of our ecommerce platforms while supporting the growth and success of our
community of users.
Marketplaces Value Proposition
We seek to attract buyers and sellers to our community by offering:
Buyers Sellers
• Trust • Access to broad global markets
• Value • Efficient marketing and distribution
• Selection • Opportunity to increase sales
• Convenience • Ability to process buyer payments efficiently and
economically
We believe our Marketplaces platforms make inefficient markets more efficient because:
• our global community of users can more easily and inexpensively communicate, exchange information
and complete transactions;
• our Marketplaces platforms make available to our users a wide variety and selection of goods; and
• we bring buyers and sellers together in a more cost-effective manner than many traditional
intermediaries and available alternatives.
2