eBay 2010 Annual Report Download - page 109
Download and view the complete annual report
Please find page 109 of the 2010 eBay annual report below. You can navigate through the pages in the report by either clicking on the pages listed below, or by using the keyword search tool below to find specific information within the annual report.-
 1
1 -
2
-
3
-
4
-
5
-
6
-
7
-
8
-
9
-
10
-
11
-
12
-
13
-
14
-
15
-
16
-
17
-
18
-
19
-
20
-
21
-
22
-
23
-
24
-
25
-
26
-
27
-
28
-
29
-
30
-
31
-
32
-
33
-
34
-
35
-
36
-
37
-
38
-
39
-
40
-
41
-
42
-
43
-
44
-
45
-
46
-
47
-
48
-
49
-
50
-
51
-
52
-
53
-
54
-
55
-
56
-
57
-
58
-
59
-
60
-
61
-
62
-
63
-
64
-
65
-
66
-
67
-
68
-
69
-
70
-
71
-
72
-
73
-
74
-
75
-
76
-
77
-
78
-
79
-
80
-
81
-
82
-
83
-
84
-
85
-
86
-
87
-
88
-
89
-
90
-
91
-
92
-
93
-
94
-
95
-
96
-
97
-
98
-
 99
99 -
 100
100 -
 101
101 -
 102
102 -
 103
103 -
 104
104 -
 105
105 -
 106
106 -
 107
107 -
 108
108 -
 109
109 -
 110
110 -
 111
111 -
 112
112 -
 113
113 -
 114
114 -
 115
115 -
 116
116 -
 117
117 -
 118
118 -
 119
119 -
120
-
121
-
122
-
123
-
124
-
125
-
126
-
127
-
128
-
129
-
130
-
131
-
132
-
133
-
134
-
135
-
136
-
137
-
138
-
139
-
140
 |
 |

eBay Inc.
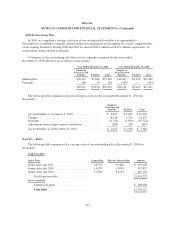
NOTES TO CONSOLIDATED FINANCIAL STATEMENTS—(Continued)
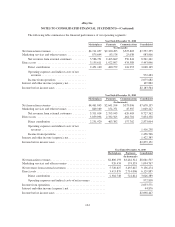
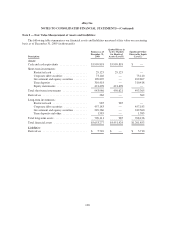
The following table summarizes the financial performance of our operating segments:
Year Ended December 31, 2008
Marketplaces Payments Communications Consolidated
(In thousands)
Net transaction revenues ........................ $4,711,057 $2,320,495 $525,803 $7,557,355
Marketing services and other revenues ............. 875,694 83,174 25,038 983,906
Net revenues from external customers ......... 5,586,751 2,403,669 550,841 8,541,261
Direct costs .................................. 3,135,611 1,922,897 434,588 5,493,096
Direct contribution ........................ 2,451,140 480,772 116,253 3,048,165
Operating expenses and indirect costs of net
revenues ............................... 972,483
Income from operations .................... 2,075,682
Interest and other income (expense), net ............ 107,882
Income before income taxes ..................... $2,183,564
Year Ended December 31, 2009
Marketplaces Payments Communications Consolidated
(In thousands)
Net transaction revenues ........................ $4,461,845 $2,641,194 $575,096 $7,678,135
Marketing services and other revenues ............. 849,169 154,751 45,307 1,049,227
Net revenues from external customers ......... 5,311,014 2,795,945 620,403 8,727,362
Direct costs .................................. 3,059,094 2,332,563 462,701 5,854,358
Direct contribution ........................ 2,251,920 463,382 157,702 2,873,004
Operating expenses and indirect costs of net
revenues ............................... 1,416,238
Income from operations .................... 1,456,766
Interest and other income (expense), net ............ 1,422,385
Income before income taxes ..................... $2,879,151
Year Ended December 31, 2010
Marketplaces Payments Consolidated
(In thousands)
Net transaction revenues ...................................... $4,800,193 $3,261,314 $8,061,507
Marketing services and other revenues .......................... 920,434 174,333 1,094,767
Net revenues from external customers ........................... 5,720,627 3,435,647 9,156,274
Direct costs ................................................ 3,415,879 2,714,006 6,129,885
Direct contribution ...................................... 2,304,748 721,641 3,026,389
Operating expenses and indirect costs of net revenues .......... 972,818
Income from operations ...................................... 2,053,571
Interest and other income (expense), net ......................... 44,876
Income before income taxes ................................... $2,098,447
104