eBay 2010 Annual Report Download - page 128
Download and view the complete annual report
Please find page 128 of the 2010 eBay annual report below. You can navigate through the pages in the report by either clicking on the pages listed below, or by using the keyword search tool below to find specific information within the annual report.-
 1
1 -
2
-
3
-
4
-
5
-
6
-
7
-
8
-
9
-
10
-
11
-
12
-
13
-
14
-
15
-
16
-
17
-
18
-
19
-
20
-
21
-
22
-
23
-
24
-
25
-
26
-
27
-
28
-
29
-
30
-
31
-
32
-
33
-
34
-
35
-
36
-
37
-
38
-
39
-
40
-
41
-
42
-
43
-
44
-
45
-
46
-
47
-
48
-
49
-
50
-
51
-
52
-
53
-
54
-
55
-
56
-
57
-
58
-
59
-
60
-
61
-
62
-
63
-
64
-
65
-
66
-
67
-
68
-
69
-
70
-
71
-
72
-
73
-
74
-
75
-
76
-
77
-
78
-
79
-
80
-
81
-
82
-
83
-
84
-
85
-
86
-
87
-
88
-
89
-
90
-
91
-
92
-
93
-
94
-
95
-
96
-
97
-
98
-
99
-
100
-
101
-
102
-
103
-
104
-
105
-
106
-
107
-
108
-
109
-
110
-
111
-
112
-
113
-
114
-
115
-
116
-
117
-
 118
118 -
 119
119 -
 120
120 -
 121
121 -
 122
122 -
 123
123 -
 124
124 -
 125
125 -
 126
126 -
 127
127 -
 128
128 -
 129
129 -
 130
130 -
 131
131 -
 132
132 -
 133
133 -
 134
134 -
 135
135 -
 136
136 -
 137
137 -
 138
138 -
139
-
140
 |
 |

eBay Inc.
NOTES TO CONSOLIDATED FINANCIAL STATEMENTS—(Continued)
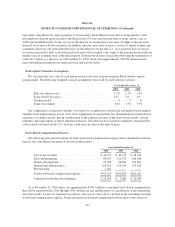
Nonvested Shares Activity
A summary of the status of and changes in nonvested shares granted under our equity incentive plans and
assumed in acquisitions as of December 31, 2010 and changes during the year ended December 31, 2010 is
presented below (in thousands, except per share amounts):
Shares
Weighted Average
Grant-Date
Fair Value
(per share)
Nonvested at January 1, 2010 .......................... 92 $30.02
Granted ........................................... — —
Vested ............................................ (82) $28.66
Forfeited ........................................... — —
Nonvested at December 31, 2010 ....................... 10 $39.90
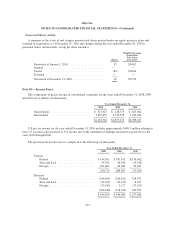
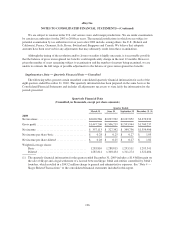
Note 18 — Income Taxes:
The components of pretax income in consolidated companies for the years ended December 31, 2008, 2009
and 2010 are as follows (in thousands):
Year Ended December 31,
2008 2009 2010
United States ............................ $ 327,927 $ 148,773 $ 847,962
International ............................ 1,855,637 2,730,378 1,250,485
$2,183,564 $2,879,151 $2,098,447
U.S pre-tax income for the year ended December 31, 2010 includes approximately $400.0 million relating to
non-U.S. income recharacterized as U.S income due to the settlement of multiple uncertain tax positions for the
years 2003 through 2006.
The provision for income taxes is comprised of the following (in thousands):
Year Ended December 31,
2008 2009 2010
Current:
Federal ............................... $414,301 $ 507,411 $(130,962)
State and local ......................... 94,763 96,496 (13,356)
Foreign ............................... 101,662 64,960 92,209
610,726 668,867 (52,109)
Deferred:
Federal ............................... (148,094) (160,811) 398,597
State and local ......................... (21,109) (20,179) 8,195
Foreign ............................... (37,433) 2,177 (57,197)
(206,636) (178,813) 349,595
$ 404,090 $ 490,054 $ 297,486
123