eBay 2010 Annual Report Download - page 67
Download and view the complete annual report
Please find page 67 of the 2010 eBay annual report below. You can navigate through the pages in the report by either clicking on the pages listed below, or by using the keyword search tool below to find specific information within the annual report.-
 1
1 -
2
-
3
-
4
-
5
-
6
-
7
-
8
-
9
-
10
-
11
-
12
-
13
-
14
-
15
-
16
-
17
-
18
-
19
-
20
-
21
-
22
-
23
-
24
-
25
-
26
-
27
-
28
-
29
-
30
-
31
-
32
-
33
-
34
-
35
-
36
-
37
-
38
-
39
-
40
-
41
-
42
-
43
-
44
-
45
-
46
-
47
-
48
-
49
-
50
-
51
-
52
-
53
-
54
-
55
-
56
-
 57
57 -
 58
58 -
 59
59 -
 60
60 -
 61
61 -
 62
62 -
 63
63 -
 64
64 -
 65
65 -
 66
66 -
 67
67 -
 68
68 -
 69
69 -
 70
70 -
 71
71 -
 72
72 -
 73
73 -
 74
74 -
 75
75 -
 76
76 -
 77
77 -
78
-
79
-
80
-
81
-
82
-
83
-
84
-
85
-
86
-
87
-
88
-
89
-
90
-
91
-
92
-
93
-
94
-
95
-
96
-
97
-
98
-
99
-
100
-
101
-
102
-
103
-
104
-
105
-
106
-
107
-
108
-
109
-
110
-
111
-
112
-
113
-
114
-
115
-
116
-
117
-
118
-
119
-
120
-
121
-
122
-
123
-
124
-
125
-
126
-
127
-
128
-
129
-
130
-
131
-
132
-
133
-
134
-
135
-
136
-
137
-
138
-
139
-
140
 |
 |

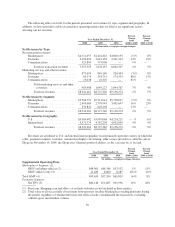
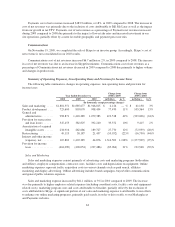
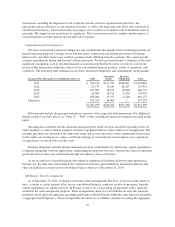
Summary of Cost of Net Revenues
The following table summarizes changes in cost of net revenues:
Year Ended December 31,
Change from
2008 to 2009
Change from
2009 to 2010
2008 2009 2010 in Dollars in % in Dollars in %
(In thousands, except percentages)
Cost of net revenues:
Marketplaces ................ $ 907,121 $ 968,266 $1,071,499 $ 61,145 7% $ 103,233 11%
As a percentage of total
Marketplaces net
revenues .............. 16.2% 18.2% 18.7%
Payments ................... 1,036,746 1,220,619 1,493,168 183,873 18% 272,549 22%
As a percentage of total
Payments net revenues . . . 43.1% 43.7% 43.5%
Communications .............. 284,202 290,877 — 6,675 2% (290,877) —
As a percentage of total
Communications net
revenues .............. 51.6% 46.9% —
Total cost of net revenues ........... $2,228,069 $2,479,762 $2,564,667 $251,693 11% $ 84,905 3%
As a percentage of net revenues ...... 26.1% 28.4% 28.0%
Cost of Net Revenues
Cost of net revenues consists primarily of costs associated with payment processing, customer support and
site operations and Skype telecommunications (through November 2009). Significant components of these costs
include bank transaction fees, credit card interchange and assessment fees, interest expense on indebtedness
incurred to finance the purchase of consumer loans receivable by Bill Me Later, employee compensation,
contractor costs, facilities costs, depreciation of equipment and amortization expense.
Marketplaces
Marketplaces cost of net revenues increased $103.2 million, or 11%, in 2010 compared to 2009. The
increase during 2010 was due primarily to the inclusion of a full year of costs attributable to Gmarket and
increased site operation costs. Marketplaces cost of net revenues as a percentage of Marketplaces net revenues
increased slightly in 2010 compared to 2009 due primarily to the addition of Gmarket, the settlement of a lawsuit
and the establishment of a reserve related to certain indirect tax positions (recorded as a reduction in revenue).
Marketplaces cost of net revenues increased $61.1 million, or 7%, in 2009 compared to 2008. The increase
during 2009 was due primarily to the inclusion of costs attributable to Gmarket and Den Blå Avis and BilBasen,
partially offset by a decrease in customer support and site operations costs associated with our restructuring
activities. Marketplaces cost of net revenues increased as a percentage of Marketplaces net revenues during 2009
compared to 2008 due primarily to the impact of foreign currency movements on revenues, pricing initiatives
(which are recorded as a reduction in revenue) and faster growth in our lower margin Marketplaces businesses.
Payments
Payments cost of net revenues increased $272.5 million, or 22%, in 2010 compared to 2009. The increase in
cost of net revenues was primarily due to the impact from our growth in net TPV. Payments cost of net revenues
as a percentage of Payments net revenues decreased slightly in 2010 compared to 2009 due primarily to
improved leverage of our customer support infrastructure and existing site operations.
62