eBay 2010 Annual Report Download - page 65
Download and view the complete annual report
Please find page 65 of the 2010 eBay annual report below. You can navigate through the pages in the report by either clicking on the pages listed below, or by using the keyword search tool below to find specific information within the annual report.-
 1
1 -
2
-
3
-
4
-
5
-
6
-
7
-
8
-
9
-
10
-
11
-
12
-
13
-
14
-
15
-
16
-
17
-
18
-
19
-
20
-
21
-
22
-
23
-
24
-
25
-
26
-
27
-
28
-
29
-
30
-
31
-
32
-
33
-
34
-
35
-
36
-
37
-
38
-
39
-
40
-
41
-
42
-
43
-
44
-
45
-
46
-
47
-
48
-
49
-
50
-
51
-
52
-
53
-
54
-
 55
55 -
 56
56 -
 57
57 -
 58
58 -
 59
59 -
 60
60 -
 61
61 -
 62
62 -
 63
63 -
 64
64 -
 65
65 -
 66
66 -
 67
67 -
 68
68 -
 69
69 -
 70
70 -
 71
71 -
 72
72 -
 73
73 -
 74
74 -
 75
75 -
76
-
77
-
78
-
79
-
80
-
81
-
82
-
83
-
84
-
85
-
86
-
87
-
88
-
89
-
90
-
91
-
92
-
93
-
94
-
95
-
96
-
97
-
98
-
99
-
100
-
101
-
102
-
103
-
104
-
105
-
106
-
107
-
108
-
109
-
110
-
111
-
112
-
113
-
114
-
115
-
116
-
117
-
118
-
119
-
120
-
121
-
122
-
123
-
124
-
125
-
126
-
127
-
128
-
129
-
130
-
131
-
132
-
133
-
134
-
135
-
136
-
137
-
138
-
139
-
140
 |
 |

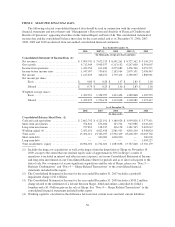
(3) Total value of all successfully closed vehicle transactions between users on eBay Marketplaces trading
platforms during the period, regardless of whether the buyer and seller actually consummated the
transaction.
(4) Total value of all successfully closed items between users on eBay Marketplaces trading platforms during
the period, regardless of whether the buyer and seller actually consummated the transaction.
(5) Total dollar volume of payments, net of payment reversals, successfully completed through our Payments
network or on Bill Me Later accounts during the period, excluding PayPal’s payment gateway business.
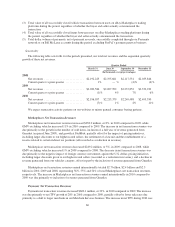
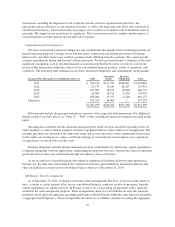
Seasonality
The following table sets forth, for the periods presented, our total net revenues and the sequential quarterly
growth of these net revenues.
Quarter Ended
March 31 June 30 September 30 December 31
(In thousands, except percentages)
2008
Net revenues ............................ $2,192,223 $2,195,661 $2,117,531 $2,035,846
Current quarter vs prior quarter ............. 1% — % (4)% (4)%
2009
Net revenues ............................ $2,020,586 $2,097,992 $2,237,852 $2,370,932
Current quarter vs prior quarter ............. (1)% 4% 7% 6%
2010
Net revenues ............................ $2,196,057 $2,215,379 $2,249,488 $2,495,350
Current quarter vs prior quarter ............. (7)% 1% 2% 11%
We expect transaction activity patterns on our websites to mirror general consumer buying patterns.
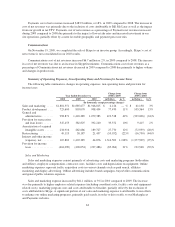
Marketplaces Net Transaction Revenues
Marketplaces net transaction revenues increased $338.3 million, or 8%, in 2010 compared to 2009, while
GMV excluding vehicles increased 11% in 2010 compared to 2009. The increase in net transaction revenues was
due primarily to the growth in the number of sold items, inclusion of a full year of revenue generated from
Gmarket (acquired June 2009), and growth at StubHub, partially offset by the impact of pricing initiatives,
including larger discounts to our highest-rated sellers, the settlement of a lawsuit and the establishment of a
reserve related to certain indirect tax positions (all recorded as a reduction in revenue).
Marketplaces net transaction revenues decreased $249.2 million, or 5%, in 2009 compared to 2008, while
GMV excluding vehicles increased 1% in 2009 compared to 2008. The decrease in net transaction revenues was
due primarily to the negative impact of foreign currency movements against the U.S. dollar; pricing initiatives,
including larger discounts given to our highest-rated sellers (recorded as a reduction in revenue); and a decline in
revenue generated from our vehicles category, offset in part by the inclusion of revenue generated from Gmarket.
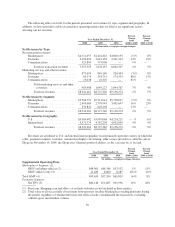
Marketplaces net transaction revenues earned internationally totaled $2.7 billion, $2.4 billion and $2.5
billion in 2010, 2009 and 2008, representing 56%, 55% and 54% of total Marketplaces net transaction revenues,
respectively. The increase in Marketplaces net transaction revenues earned internationally in 2010 compared to
2009 was due primarily to inclusion of revenues generated from Gmarket.
Payments Net Transaction Revenues
Payments net transaction revenues increased $620.1 million, or 23%, in 2010 compared to 2009. The increase
was due primarily to net TPV growth of 28% in 2010 compared to 2009, partially offset by lower take rates due
primarily to a shift to larger merchants in our Merchant Services business. The increase in net TPV during 2010 was
60