eBay 2010 Annual Report Download - page 112
Download and view the complete annual report
Please find page 112 of the 2010 eBay annual report below. You can navigate through the pages in the report by either clicking on the pages listed below, or by using the keyword search tool below to find specific information within the annual report.-
 1
1 -
2
-
3
-
4
-
5
-
6
-
7
-
8
-
9
-
10
-
11
-
12
-
13
-
14
-
15
-
16
-
17
-
18
-
19
-
20
-
21
-
22
-
23
-
24
-
25
-
26
-
27
-
28
-
29
-
30
-
31
-
32
-
33
-
34
-
35
-
36
-
37
-
38
-
39
-
40
-
41
-
42
-
43
-
44
-
45
-
46
-
47
-
48
-
49
-
50
-
51
-
52
-
53
-
54
-
55
-
56
-
57
-
58
-
59
-
60
-
61
-
62
-
63
-
64
-
65
-
66
-
67
-
68
-
69
-
70
-
71
-
72
-
73
-
74
-
75
-
76
-
77
-
78
-
79
-
80
-
81
-
82
-
83
-
84
-
85
-
86
-
87
-
88
-
89
-
90
-
91
-
92
-
93
-
94
-
95
-
96
-
97
-
98
-
99
-
100
-
101
-
 102
102 -
 103
103 -
 104
104 -
 105
105 -
 106
106 -
 107
107 -
 108
108 -
 109
109 -
 110
110 -
 111
111 -
 112
112 -
 113
113 -
 114
114 -
 115
115 -
 116
116 -
 117
117 -
 118
118 -
 119
119 -
 120
120 -
 121
121 -
 122
122 -
123
-
124
-
125
-
126
-
127
-
128
-
129
-
130
-
131
-
132
-
133
-
134
-
135
-
136
-
137
-
138
-
139
-
140
 |
 |

eBay Inc.
NOTES TO CONSOLIDATED FINANCIAL STATEMENTS—(Continued)
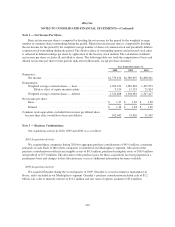
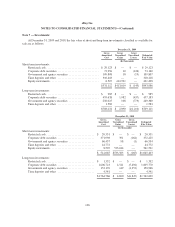
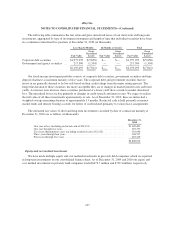
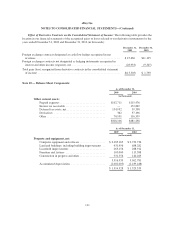
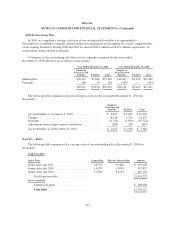
The following table summarizes the fair value and gross unrealized losses of our short-term and long-term
investments, aggregated by type of investment instrument and length of time that individual securities have been
in a continuous unrealized loss position, at December 31, 2010 (in thousands):
Less than 12 Months 12 Months or Greater Total
Fair Value
Gross
Unrealized
Losses Fair Value
Gross
Unrealized
Losses Fair Value
Gross
Unrealized
Losses
Corporate debt securities ........... $1,977,995 $(5,658) $— $— $1,977,995 $(5,658)
Government and agency securities . . . 217,500 (1,354) — — 217,500 (1,354)
$2,195,495 $(7,012) $— $— $2,195,495 $(7,012)
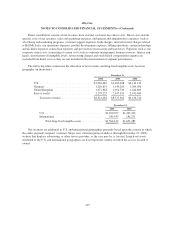
Our fixed-income investment portfolio consists of corporate debt securities, government securities and time
deposits that have a maximum maturity of five years. The corporate debt and government securities that we
invest in are generally deemed to be low risk based on their credit ratings from the major rating agencies. The
longer the duration of these securities, the more susceptible they are to changes in market interest rates and bond
yields. As interest rates increase, those securities purchased at a lower yield show a mark-to-market unrealized
loss. The unrealized losses are due primarily to changes in credit spreads and interest rates. We expect to realize
the full value of all these investments upon maturity or sale. As of December 31, 2010, these securities had a
weighted average remaining duration of approximately 13 months. Restricted cash is held primarily in money
market funds and interest bearing accounts for letters of credit related primarily to various lease arrangements.
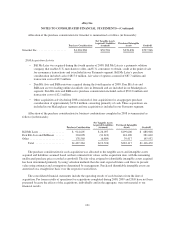
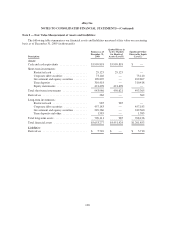
The estimated fair values of short and long-term investments classified by date of contractual maturity at
December 31, 2010 are as follows (in thousands):
December 31,
2010
One year or less (including restricted cash of $20,351) .......................... $1,045,403
One year through two years ............................................... 507,777
Two years through three years (including restricted cash of $1,332) ............... 783,096
Three years through four years ............................................. 204,517
Four years through five years .............................................. 267,219
$2,808,012
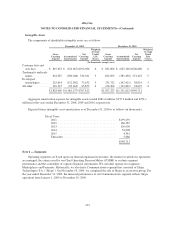
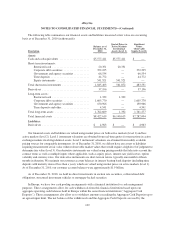
Equity and cost method investments
We have made multiple equity and cost method investments in privately held companies which are reported
in long-term investments on our consolidated balance sheet. As of December 31, 2009 and 2010 our equity and
cost method investments in privately held companies totaled $672.7 million and $729.4 million, respectively.
107