Xcel Energy 2003 Annual Report Download - page 7
Download and view the complete annual report
Please find page 7 of the 2003 Xcel Energy annual report below. You can navigate through the pages in the report by either clicking on the pages listed below, or by using the keyword search tool below to find specific information within the annual report.-
 1
1 -
 2
2 -
 3
3 -
 4
4 -
 5
5 -
 6
6 -
 7
7 -
 8
8 -
 9
9 -
 10
10 -
 11
11 -
 12
12 -
 13
13 -
 14
14 -
 15
15 -
 16
16 -
 17
17 -
 18
18 -
19
-
20
-
21
-
22
-
23
-
24
-
25
-
26
-
27
-
28
-
29
-
30
-
31
-
32
-
33
-
34
-
35
-
36
-
37
-
38
-
39
-
40
-
41
-
42
-
43
-
44
-
45
-
46
-
47
-
48
-
49
-
50
-
51
-
52
-
53
-
54
-
55
-
56
-
57
-
58
-
59
-
60
-
61
-
62
-
63
-
64
-
65
-
66
-
67
-
68
-
69
-
70
-
71
-
72
-
73
-
74
 |
 |
MANAGEMENT’S DISCUSSION AND ANALYSIS
XCEL ENERGY 2003 ANNUAL REPORT 23
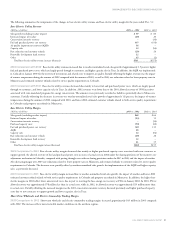
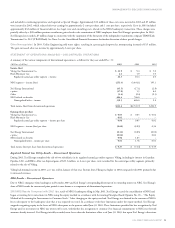
2003 Comparison to 2002 Nonregulated revenue increased in 2003, due mainly to increasing customer levels in Seren’s communication business.
Nonregulated margin decreased in 2003, due to higher cost of goods sold at a subsidiary of Utility Engineering offsetting the revenue increases at Seren.
2002 Comparison to 2001 Nonregulated margin decreased in 2002 compared to 2001, due to higher cost of goods sold at a subsidiary of
Utility Engineering.
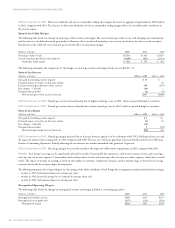
Non-Fuel Operating Expense and Other Items
Other Utility Operating and Maintenance Expense Other utility operating and maintenance expense for 2003 increased by approximately
$91 million, or 6.1 percent, compared with 2002. The increase is due primarily to higher employee related costs, including higher performance-based
compensation of $36 million, restricted stock unit grants of $29 million, lower pension credits of $19 million and higher medical and health care
costs of $9 million. In 2002, there were no restricted stock unit grants and only a partial award of performance-based compensation. In addition,
other utility operating and maintenance expense for 2003 reflects inventory write-downs of $8 million, higher uncollectible accounts receivable of
$3 million, higher reliability expenses of $6 million and a software project write-off of $2 million. The increase was partially offset by lower information
technology costs resulting from centralization.
Other utility operating and maintenance expense for 2002 decreased by approximately $3 million, or 0.2 percent, compared with 2001. The decreased
costs reflect lower incentive compensation and other employee benefit costs of $20 million, as well as lower staffing levels in the corporate areas of
approximately $11 million due to completion of the corporate merger synergy plans in late 2001. These decreases were substantially offset by higher
costs associated with plant outages of $11 million due to planned outages at multiple plants and higher property insurance costs of $9 million due
to unfavorable market conditions in 2002, in addition to inflationary factors such as market wage increases and general market inflation.
Other Nonregulated Operating and Maintenance Expense Other nonregulated operating and maintenance expenses decreased $8 million, or
7.7 percent, in 2003 compared with 2002. Other nonregulated operating and maintenance expenses in 2002 increased $20 million, or 22.8 percent,
compared with 2001. The 2002 expenses included employee severance costs at the holding company. These expenses are included in the results for each
nonregulated subsidiary, as discussed later.
Depreciation and Amortization Expense Depreciation and amortization expense decreased by approximately $15 million, or 2.0 percent, for 2003,
compared with 2002. This decrease reflects the impacts of nuclear plant life extensions at Prairie Island and certain depreciation rate changes in Colorado,
partially offset by increasing depreciation related to plant additions. The increase in depreciation and amortization in 2002 compared with 2001 is also
due to the impacts of plant additions.
In December 2003, the Minnesota Public Utilities Commission (MPUC) extended the authorized useful lives of the two NSP-Minnesota generating
units at the Prairie Island nuclear plant until 2013 and 2014, respectively. The recovery was effective Jan. 1, 2003, and the net effect on depreciation
and amortization, partially offset by revisions to nuclear decommissioning accrual, was a $22 million decrease in depreciation expense. In addition,
effective July 1, 2003, the Colorado Public Utilities Commission (CPUC) lengthened the depreciable lives of certain electric utility plant at PSCo
as a part of the general Colorado rate case, which will reduce annual depreciation expense by $20 million and reduced 2003 depreciation expense
by approximately $10 million.
Special Charges Special charges reported in 2003 relate to the TRANSLink project and NRG restructuring costs. Special charges for 2002 include
NRG restructuring costs, as discussed later, but are largely related to regulated utility costs as discussed in the following paragraph. All 2001 special
charges relate to utility costs. See Note 2 to the Consolidated Financial Statements for further discussion of these items.
Regulated utility earnings from continuing operations were reduced by approximately 2 cents per share in 2002 due to a $5 million regulatory recovery
adjustment for SPS and $9 million in employee separation costs associated with a restaffing initiative for utility and service company operations.
Regulated utility earnings from continuing operations in 2001 were lower by 4 cents per share due to a Colorado Supreme Court decision that
resulted in a pretax write-off of $23 million of a regulatory asset related to deferred post-employment benefit costs at PSCo. Also, regulated utility earnings
from continuing operations were reduced by approximately 7 cents per share in 2001 due to $39 million of employee separation costs associated with a
restaffing initiative late in the year for utility and service company operations.
Interest and Other Income, Net of Nonoperating Expenses Interest and other income, net of nonoperating expenses decreased $9 million in 2003
compared with 2002. Interest income decreased $13 million in 2003 compared with 2002 primarily due to interest received on tax refunds in 2002.
Other income decreased $11 million primarily due to a gain on the sale of contracts at Planergy in 2002. Partially offsetting these decreases was an
increase in allowance for funds used during construction resulting from lower levels of short-term debt used to finance utility construction.
Interest and other income, net of nonoperating expenses increased $14 million from 2002 compared with 2001. Interest income increased by $8 million
primarily due to interest received on tax refunds in 2002. Other income increased by $13 million, primarily due to a gain on the sale of contracts at
Planergy in 2002. Partially offsetting these increases was a decrease in the gain on disposal of assets of $5 million due to a gain recorded in 2001 by PSCo.
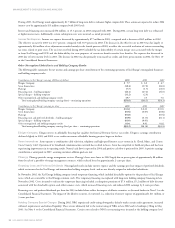
Interest and Financing Costs Interest and financing costs increased approximately $30 million, or 7.1 percent, for 2003 compared with 2002. This
increase was due to the full-year impact of the issuance of long-term debt in the latter part of 2002 intended to reduce dependence on short-term
debt. In addition, during the fourth quarter of 2002, Xcel Energy incurred approximately $15 million to redeem temporary holding company debt.