Xcel Energy 2003 Annual Report Download - page 29
Download and view the complete annual report
Please find page 29 of the 2003 Xcel Energy annual report below. You can navigate through the pages in the report by either clicking on the pages listed below, or by using the keyword search tool below to find specific information within the annual report.-
 1
1 -
2
-
3
-
4
-
5
-
6
-
7
-
8
-
9
-
10
-
11
-
12
-
13
-
14
-
15
-
16
-
17
-
18
-
 19
19 -
 20
20 -
 21
21 -
 22
22 -
 23
23 -
 24
24 -
 25
25 -
 26
26 -
 27
27 -
 28
28 -
 29
29 -
 30
30 -
 31
31 -
 32
32 -
 33
33 -
 34
34 -
 35
35 -
 36
36 -
 37
37 -
 38
38 -
 39
39 -
40
-
41
-
42
-
43
-
44
-
45
-
46
-
47
-
48
-
49
-
50
-
51
-
52
-
53
-
54
-
55
-
56
-
57
-
58
-
59
-
60
-
61
-
62
-
63
-
64
-
65
-
66
-
67
-
68
-
69
-
70
-
71
-
72
-
73
-
74
 |
 |

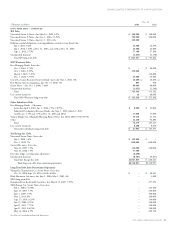
CONSOLIDATED STATEMENTS OF STOCKHOLDERS’ EQUITY AND OTHER COMPREHENSIVE INCOME
XCEL ENERGY 2003 ANNUAL REPORT 45
Accumulated
Common Stock Issued Retained Other Total
Capital in Excess Earnings Shares Held Comprehensive Stockholders’
(Thousands) Shares Par Value of Par Value (Deficit) by ESOP Income (Loss) Equity
Balance at Dec. 31, 2000 340,834 $852,085 $2,607,025 $2,284,220 $(24,617) $(156,929) $5,561,784
Net income 794,966 794,966
Currency translation adjustments (56,693) (56,693)
Cumulative effect of accounting change – net
Unrealized transition loss upon adoption of
SFAS No. 133 (see Note 16) (28,780) (28,780)
After-tax net unrealized gains related to
derivatives (see Note 16) 63,023 63,023
Unrealized loss – marketable securities (75) (75)
Comprehensive income for 2001 772,441
Dividends declared:
Cumulative preferred stock (4,241) (4,241)
Common stock (516,515) (516,515)
Issuances of common stock – net proceeds 4,967 12,418 120,673 133,091
Other (27) (27)
Gain from NRG stock offering 241,891 241,891
Repayment of ESOP loan 6,053 6,053
Balance at Dec. 31, 2001 345,801 864,503 2,969,589 2,558,403 (18,564) (179,454) 6,194,477
Net loss (2,217,991) (2,217,991)
Currency translation adjustments 30,008 30,008
Minimum pension liability (107,782) (107,782)
After-tax net unrealized losses related to
derivatives (see Note 16) (39,475) (39,475)
Unrealized loss – marketable securities (457) (457)
Comprehensive loss for 2002 (2,335,697)
Dividends declared:
Cumulative preferred stock (4,241) (4,241)
Common stock (437,113) (437,113)
Issuances of common stock – net proceeds 27,148 67,870 513,342 581,212
Acquisition of NRG minority common shares 25,765 64,412 555,220 28,150 647,782
Repayment of ESOP loan 18,564 18,564
Balance at Dec. 31, 2002 398,714 996,785 4,038,151 (100,942) – (269,010) 4,664,984
Net income 622,392 622,392
Currency translation adjustments 182,829 182,829
Minimum pension liability 9,710 9,710
After-tax net unrealized losses related to
derivatives (see Note 16) (14,005) (14,005)
Unrealized gain – marketable securities 340 340
Comprehensive income for 2003 801,266
Dividends declared:
Cumulative preferred stock (720) (3,181) (3,901)
Common stock (149,521) (149,606) (299,127)
Issuances of common stock – net proceeds 251 627 2,591 3,218
Balance at Dec. 31, 2003 398,965 $997,412 $3,890,501 $ 368,663 $ – $ (90,136) $5,166,440
See Notes to Consolidated Financial Statements.