Xcel Energy 2003 Annual Report Download - page 19
Download and view the complete annual report
Please find page 19 of the 2003 Xcel Energy annual report below. You can navigate through the pages in the report by either clicking on the pages listed below, or by using the keyword search tool below to find specific information within the annual report.-
 1
1 -
2
-
3
-
4
-
5
-
6
-
7
-
8
-
 9
9 -
 10
10 -
 11
11 -
 12
12 -
 13
13 -
 14
14 -
 15
15 -
 16
16 -
 17
17 -
 18
18 -
 19
19 -
 20
20 -
 21
21 -
 22
22 -
 23
23 -
 24
24 -
 25
25 -
 26
26 -
 27
27 -
 28
28 -
 29
29 -
30
-
31
-
32
-
33
-
34
-
35
-
36
-
37
-
38
-
39
-
40
-
41
-
42
-
43
-
44
-
45
-
46
-
47
-
48
-
49
-
50
-
51
-
52
-
53
-
54
-
55
-
56
-
57
-
58
-
59
-
60
-
61
-
62
-
63
-
64
-
65
-
66
-
67
-
68
-
69
-
70
-
71
-
72
-
73
-
74
 |
 |

MANAGEMENT’S DISCUSSION AND ANALYSIS
XCEL ENERGY 2003 ANNUAL REPORT 35
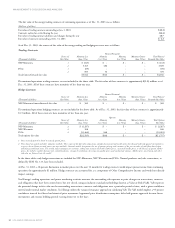
As of Dec. 31, 2003, the calculated VaRs were:
During 2003
(Millions of dollars) Year ended Dec. 31, 2003 Average High Low
Electric commodity trading(a) $0.92 $ 0.70 $ 1.51 $ 0.29
Natural gas commodity trading(b) $ – $ 0.06 $ 0.89 $ –
Natural gas retail marketing(b) $0.08 $ 0.32 $ 1.00 $ 0.02
Other $ – $ 0.02 $ 0.15 $ –
(a) Comprises transactions for both NSP-Minnesota and PSCo.
(b) Conducted by e prime, which is a discontinued operation held for sale.
As of Dec. 31, 2002, the calculated VaRs were:
During 2002
(Millions of dollars) Year ended Dec. 31, 2002 Average High Low
Electric commodity trading(a) $ 0.29 $ 0.62 $ 3.39 $ 0.01
Natural gas commodity trading(c) $ 0.11 $ 0.35 $ 1.09 $ 0.09
Natural gas retail marketing(c) $ 0.54 $ 0.47 $ 0.92 $ 0.32
NRG power marketing(b) $118.60 $76.20 $124.40 $42.00
(a) Comprises transactions for both NSP-Minnesota and PSCo.
(b) NRG VaR was an undiversified VaR. NRG is presented as discontinued operations.
(c) Conducted by e prime, which is a discontinued operation held for sale.
Credit Risk In addition to the risks discussed previously, Xcel Energy and its subsidiaries are exposed to credit risk in the company’s risk management
activities. Credit risk relates to the risk of loss resulting from the nonperformance by a counterparty of its contractual obligations. Xcel Energy and its
subsidiaries maintain credit policies intended to minimize overall credit risk and actively monitor these policies to reflect changes and scope of operations.
Xcel Energy and its subsidiaries conduct standard credit reviews for all counterparties. Xcel Energy employs additional credit risk control mechanisms
when appropriate, such as letters of credit, parental guarantees, standardized master netting agreements and termination provisions that allow for offsetting
of positive and negative exposures. The credit exposure is monitored and, when necessary, the activity with a specific counterparty is limited until credit
enhancement is provided.
At Dec. 31, 2003, a 10 percent increase in prices would have resulted in a net mark-to-market increase in credit risk exposure of $3.6 million, while a
decrease of 10 percent would have resulted in a decrease of $3.9 million.
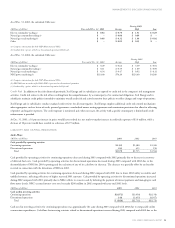
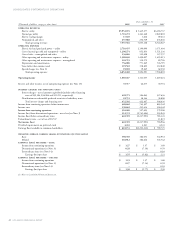
LIQUIDITY AND CAPITAL RESOURCES
Cash Flows
(Millions of dollars) 2003 2002 2001
Cash provided by operating activities
Continuing operations $1,135 $1,300 $1,388
Discontinued operations 243 415 196
Total $1,378 $1,715 $1,584
Cash provided by operating activities for continuing operations decreased during 2003 compared with 2002 primarily due to decreases in recovery
of deferred fuel costs. Cash provided by operating activities for discontinued operations decreased during 2003 compared with 2002 due to the
deconsolidation of NRG for 2003 reporting and the exclusion of any of its cash flows in that year. The decrease was partially offset by tax benefits
received in connection with the divestiture of NRG in 2003.
Cash provided by operating activities for continuing operations decreased during 2002 compared with 2001 due to lower 2002 utility receivables and
unbilled revenues, reflecting collections of higher year-end 2001 amounts. Cash provided by operating activities for discontinued operations increased
during 2002 compared with 2001 primarily due to NRG’s efforts to conserve cash by deferring the payment of interest payments and managing its cash
flows more closely. NRG’s accrued interest costs rose by nearly $200 million in 2002 compared with year-end 2001 levels.
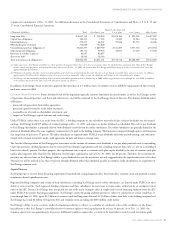
(Millions of dollars) 2003 2002 2001
Cash used in investing activities
Continuing operations $(1,072) $(1,056) $(1,156)
Discontinued operations 146 (1,655) (4,017)
Total $(926) $(2,711) $(5,173)
Cash used in investing activities for continuing operations was approximately the same during 2003 compared with 2002 due to comparable utility
construction expenditures. Cash flows for investing activities related to discontinued operations increased during 2003 compared with 2002 due to the