Xcel Energy 2003 Annual Report Download - page 27
Download and view the complete annual report
Please find page 27 of the 2003 Xcel Energy annual report below. You can navigate through the pages in the report by either clicking on the pages listed below, or by using the keyword search tool below to find specific information within the annual report.-
 1
1 -
2
-
3
-
4
-
5
-
6
-
7
-
8
-
9
-
10
-
11
-
12
-
13
-
14
-
15
-
16
-
 17
17 -
 18
18 -
 19
19 -
 20
20 -
 21
21 -
 22
22 -
 23
23 -
 24
24 -
 25
25 -
 26
26 -
 27
27 -
 28
28 -
 29
29 -
 30
30 -
 31
31 -
 32
32 -
 33
33 -
 34
34 -
 35
35 -
 36
36 -
 37
37 -
38
-
39
-
40
-
41
-
42
-
43
-
44
-
45
-
46
-
47
-
48
-
49
-
50
-
51
-
52
-
53
-
54
-
55
-
56
-
57
-
58
-
59
-
60
-
61
-
62
-
63
-
64
-
65
-
66
-
67
-
68
-
69
-
70
-
71
-
72
-
73
-
74
 |
 |

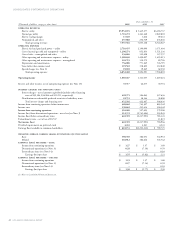
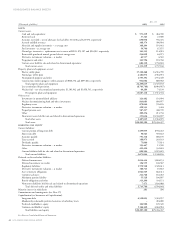
CONSOLIDATED STATEMENTS OF CASH FLOWS
XCEL ENERGY 2003 ANNUAL REPORT 43
Year ended Dec. 31
(Thousands of dollars) 2003 2002 2001
OPERATING ACTIVITIES
Net (loss) income $ 622,392 $(2,217,991) $ 794,966
Remove (income) loss from discontinued operations (112,372) 2,745,684 (203,945)
Adjustments to reconcile net income to cash provided by operating activities:
Depreciation and amortization 786,532 792,954 767,445
Nuclear fuel amortization 43,401 48,675 41,928
Deferred income taxes 113,985 148,765 (9,653)
Amortization of investment tax credits (12,499) (13,272) (12,867)
Allowance for equity funds used during construction (25,338) (7,793) (6,739)
Undistributed equity in earnings of unconsolidated affiliates (5,628) 5,774 (5,275)
Gain on sale of property –(6,785) –
Write-downs and losses from investments 8,856 15,866 –
Unrealized gain on derivative financial instruments (1,954) 17,779 (6,237)
Extraordinary items – net of tax (see Note 14) ––(11,821)
Change in accounts receivable (129,971) 28,155 126,110
Change in inventories 3,230 (21,313) (47,972)
Change in other current assets (172,100) 116,632 402,543
Change in accounts payable 102,734 (137,050) (346,352)
Change in other current liabilities (4,070) (139,917) 78,524
Change in other noncurrent assets (133,364) (215,836) (299,162)
Change in other noncurrent liabilities 50,798 139,885 126,735
Operating cash flows provided by discontinued operations 243,354 414,899 195,784
Net cash provided by operating activities 1,377,986 1,715,111 1,584,012
INVESTING ACTIVITIES
Utility capital/construction expenditures (950,940) (908,878) (1,103,685)
Allowance for equity funds used during construction 25,338 7,793 6,739
Investments in external decommissioning fund (80,581) (57,830) (54,996)
Nonregulated capital expenditures and asset acquisitions (42,287) (64,117) (53,852)
Equity investments, loans, deposits and sales of nonregulated projects 13,300 (17,253) 3,316
Restricted cash (38,488) (23,000) –
Other investments – net 1,069 7,001 46,584
Investing cash flows provided by (used in) discontinued operations 146,493 (1,655,042) (4,016,631)
Net cash used in investing activities (926,096) (2,711,326) (5,172,525)
FINANCING ACTIVITIES
Short-term borrowings – net (445,080) (867,466) 85,921
Proceeds from issuance of long-term debt 1,689,317 1,442,172 307,058
Repayment of long-term debt, including reacquisition premiums (1,311,012) (32,802) (437,692)
Proceeds from issuance of common stock 3,219 69,488 129,011
Dividends paid (303,316) (496,375) (518,894)
Financing cash flows provided by discontinued operations –1,465,070 4,147,928
Net cash (used in) provided by financing activities (366,872) 1,580,087 3,713,332
Net increase in cash and cash equivalents 85,018 583,872 124,819
Net increase (decrease) in cash and cash equivalents – discontinued operations 3,521 (241,453) (98,092)
Cash and cash equivalents at beginning of year 484,700 142,281 115,554
Cash and cash equivalents at end of year $ 573,239 $484,700 $ 142,281
Supplemental disclosure of cash flow information:
Cash paid for interest (net of amounts capitalized) $ 402,506 $640,628 $ 708,560
Cash paid for income taxes (net of refunds received) $(6,379) $ 24,935 $ 327,018
See Notes to Consolidated Financial Statements.