Xcel Energy 2003 Annual Report Download - page 5
Download and view the complete annual report
Please find page 5 of the 2003 Xcel Energy annual report below. You can navigate through the pages in the report by either clicking on the pages listed below, or by using the keyword search tool below to find specific information within the annual report.-
 1
1 -
 2
2 -
 3
3 -
 4
4 -
 5
5 -
 6
6 -
 7
7 -
 8
8 -
 9
9 -
 10
10 -
 11
11 -
 12
12 -
 13
13 -
 14
14 -
 15
15 -
 16
16 -
17
-
18
-
19
-
20
-
21
-
22
-
23
-
24
-
25
-
26
-
27
-
28
-
29
-
30
-
31
-
32
-
33
-
34
-
35
-
36
-
37
-
38
-
39
-
40
-
41
-
42
-
43
-
44
-
45
-
46
-
47
-
48
-
49
-
50
-
51
-
52
-
53
-
54
-
55
-
56
-
57
-
58
-
59
-
60
-
61
-
62
-
63
-
64
-
65
-
66
-
67
-
68
-
69
-
70
-
71
-
72
-
73
-
74
 |
 |

MANAGEMENT’S DISCUSSION AND ANALYSIS
XCEL ENERGY 2003 ANNUAL REPORT 21
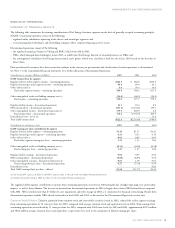
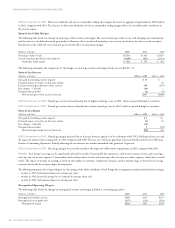
The following summarizes the components of the changes in base electric utility revenue and base electric utility margin for the years ended Dec. 31:
Base Electric Utility Revenue
(Millions of dollars) 2003 vs. 2002 2002 vs. 2001
Sales growth (excluding weather impact) $59 $80
Estimated impact of weather (29) 20
Conservation incentive recovery –(34)
Fuel and purchased power cost recovery 435 (414)
Air quality improvement recovery (AQIR) 36 –
Capacity sales 12 (54)
Rate reductions and customer refunds (29) 28
Renewable development fund recovery 12 –
Other 45 (1)
Total base electric utility revenue increase (decrease) $541 $(375)
2003 Comparison with 2002 Base electric utility revenues increased due to weather-normalized retail sales growth of approximately 1.5 percent, higher
fuel and purchased power costs, which are largely passed through to customers, and higher capacity sales in Texas. In addition, the AQIR was implemented
in Colorado in January 2003 for the recovery of investments and related costs to improve air quality. Partially offsetting the higher revenues was the impact
of warmer temperatures during the summer of 2002 compared with the summer of 2003, as well as 2003 rate reductions related to lower property taxes in
Minnesota and estimated customer refunds related to service quality requirements in Colorado.
2002 Comparison with 2001 Base electric utility revenues decreased due mainly to lower fuel and purchased power costs, which are largely passed
through to customers, and lower capacity sales in Texas. In addition, 2002 revenues were lower due to the 2001 allowed recovery of 1998 incentives
associated with state-mandated programs for energy conservation. The amounts were previously recorded as liabilities potentially due to Minnesota
customers. Partially offsetting the decreases in revenue was weather-normalized retail sales growth of approximately 1.8 percent, the impact of warmer
temperatures during the summer of 2002 compared with 2001, and lower 2002 estimated customer refunds related to both service quality requirements
in Colorado and property tax refunds in Minnesota.
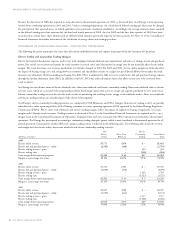
Base Electric Utility Margin
(Millions of dollars) 2003 vs. 2002 2002 vs. 2001
Sales growth (excluding weather impact) $48 $ 64
Estimated impact of weather (23) 15
Conservation incentive recovery –(34)
Purchased capacity costs (50) (32)
Fuel and purchased power cost recovery (41) 133
AQIR 28 –
Capacity sales 12 (54)
Rate reductions and customer refunds (29) 28
Renewable development fund recovery 12 –
Other 21 35
Total base electric utility margin increase (decrease) $(22) $155
2003 Comparison to 2002 Base electric utility margin decreased due mainly to higher purchased capacity costs associated with new contracts to
support growth, the allowed recovery of fuel and purchased power costs in excess of actual costs in 2002 under the sharing provisions of the incentive cost
adjustment mechanism in Colorado, compared with passing through costs with no sharing provisions under the IAC in 2003 and the impact of weather.
Also decreasing margin were 2003 rate reductions related to lower property taxes in Minnesota and estimated refunds to customers related to service quality
requirements in Colorado. The decreases were partially offset by weather-normalized sales growth, the implementation of the AQIR and higher capacity
sales, as previously discussed.
2002 Comparison to 2001 Base electric utility margin increased due to weather-normalized retail sales growth, the impact of weather and lower 2002
estimated customer refunds related to both service quality requirements in Colorado and property tax refunds in Minnesota. In addition, the higher base
electric margins in 2002 reflect lower unrecovered costs, due in part to resetting the base-energy-cost recovery at PSCo in January 2002. In 2001, PSCo’s
allowed recovery was approximately $78 million less than its actual costs, while in 2002, its allowed recovery was approximately $29 million more than
its actual costs. Partially offsetting the increased margin was the 2001 conservation incentive recovery discussed previously and higher purchased capacity
costs due to new contracts to support growth and lower capacity sales in Texas.
Short-Term Wholesale and Electric Commodity Trading Margin
2003 Comparison to 2002 Short-term wholesale and electric commodity trading margins increased approximately $43 million in 2003 compared
with 2002. The increase reflects more favorable market conditions in the northern regions.