Volvo 1997 Annual Report Download - page 89
Download and view the complete annual report
Please find page 89 of the 1997 Volvo annual report below. You can navigate through the pages in the report by either clicking on the pages listed below, or by using the keyword search tool below to find specific information within the annual report.-
 1
1 -
2
-
3
-
4
-
5
-
6
-
7
-
8
-
9
-
10
-
11
-
12
-
13
-
14
-
15
-
16
-
17
-
18
-
19
-
20
-
21
-
22
-
23
-
24
-
25
-
26
-
27
-
28
-
29
-
30
-
31
-
32
-
33
-
34
-
35
-
36
-
37
-
38
-
39
-
40
-
41
-
42
-
43
-
44
-
45
-
46
-
47
-
48
-
49
-
50
-
51
-
52
-
53
-
54
-
55
-
56
-
57
-
58
-
59
-
60
-
61
-
62
-
63
-
64
-
65
-
66
-
67
-
68
-
69
-
70
-
71
-
72
-
73
-
74
-
75
-
76
-
77
-
78
-
 79
79 -
 80
80 -
 81
81 -
 82
82 -
 83
83 -
 84
84 -
 85
85 -
 86
86 -
 87
87 -
 88
88 -
 89
89 -
 90
90 -
 91
91 -
 92
92 -
 93
93
 |
 |
87
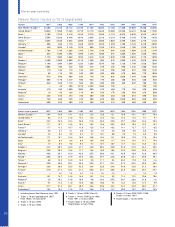
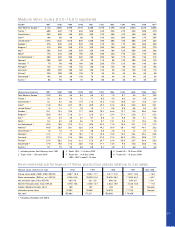
Medium Volvo trucks (10.0–15.9 t) registered
Number 1987 1988 1989 1990 1991 1992 1993 1994 1995 1996 1997
Total Western Europe 24,140 3,580 3,990 3,770 3,300 3,190 2,290 2,540 3,040 3,220 3,050
France 4680 640 710 640 550 440 340 470 540 500 570
Great Britain 3340 350 440 530 360 370 390 470 450 480 430
Israel5100 80 60 60 70 310 330 380 360 270 360
United States 61,670 1,430 1,010 830 1,300 780 680 740 800 670 330
Sweden 2570 530 670 520 290 210 130 170 180 360 330
Belgium 2410 300 360 370 340 300 260 260 250 320 270
Italy 5250 240 260 330 320 340 180 220 380 290 240
Spain2170 220 250 190 240 260 240 170 240 210 230
the Netherlands 2380 330 350 360 280 350 160 170 180 190 210
Norway 2200 100 80 70 70 110 90 120 200 180 170
Germany 1, 2 70 90 100 100 290 350 170 120 160 190 150
Portugal2140 110 120 120 120 130 120 90 120 140 150
Denmark3350 230 180 160 150 120 90 130 130 130 110
Finland2220 200 190 130 70 20 20 40 60 90 80
Switzerland 2150 90 90 130 70 50 40 20 40 50 30
Austria 280 90 90 70 90 80 30 40 40 30 30
Market share in percent 1987 1988 1989 1990 1991 1992 1993 1994 1995 1996 1997
Total Western Europe 210.0 8.6 9.8 9.4 8.9 8.7 7.5 8.7 9.4 10.1 10.3
France 48.1 6.9 7.9 7.2 7.1 6.5 4.5 6.3 6.4 5.8 6.9
Great Britain 36.1 6.4 8.4 11.9 11.6 12.4 12.3 15.0 14.2 14.0 14.7
Israel221.8 19.3 23.7 20.1 20.9 42.2 47.6 48.0 39.0 33.2 39.1
United States 61.6 1.4 1.1 1.0 1.8 1.1 0.8 0.8 0.8 0.6 0.3
Sweden 276.1 74.4 75.6 71.7 68.5 75.4 64.6 72.7 74.0 80.4 66.4
Belgium 228.0 19.3 21.0 21.1 22.5 22.1 23.4 27.4 23.0 27.1 23.3
Italy 53.6 3.3 3.5 4.7 5.7 6.0 4.1 5.0 6.6 5.1 5.8
Spain 25.2 6.2 6.8 4.6 7.3 8.7 13.1 9.6 11.1 10.4 9.9
the Netherlands 220.9 18.0 22.3 21.4 20.6 24.3 17.6 18.9 23.1 17.0 21.2
Norway 240.0 28.9 39.1 32.6 31.9 44.2 36.9 38.1 46.5 40.1 33.3
Great Britain 1, 2 1.0 1.5 1.7 1.5 3.0 3.0 2.0 1.6 2.2 2.9 2.4
Portugal212.4 7.1 8.8 10.4 11.3 13.0 15.5 15.3 28.4 30.4 25.5
Denmark332.2 31.5 31.6 28.8 32.9 31.0 31.5 35.3 33.3 30.8 27.1
Finland237.9 38.2 34.2 31.2 27.3 24.7 23.9 35.0 28.7 36.4 38.3
Switzerland 227.9 19.0 21.3 26.5 15.5 17.7 13.9 9.0 15.0 20.8 17.5
Austria 25.7 7.9 9.3 6.8 8.5 8.4 4.0 5.7 6.8 6.5 6.3
1 Including former East Germany from 1991
2 Trucks 10.0 – 15.9 tons GVW
3 Trucks 10.0 – 14.9 tons GVW
4 Trucks 9.0 – 14.9 tons GVW
1993–1997, trucks 6–16 tons
5 Trucks 9.0 – 15.9 tons GVW
6 Trucks 9.0 – 12.0 tons GVW
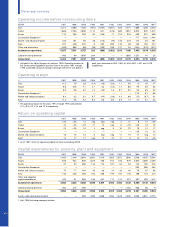
Environm ental performance of Volvo production plants relative to net sales
Absolute values: relative to net sales 1994 1995 1996 1997 Goal 1998
Energy consumption (GWh: MWh/ SEK M) 2,807: 18.0 3,042: 17.7 3,277: 21.0 3,021: 16.8 –: 16.0
Water consumption (´000 m3: m3/ SEK M) 9,765: 62.6 10,620: 61.9 10,836: 69.4 11,596: 64.4 –: 55.7
Nox emissions (tons: kilos/ SEK M) 663: 4.3 621: 3.6 600: 3.8 639: 3.5 –: 3,4
Solvent emissions (tons: kilos/ SEK M) 2,570: 16.5 2,520: 14.7 2,633: 16.9 2,348: 13.0 –: 11.0
Sulphur dioxide emissions (tons) 168 152 169 95 No goal
Hazardous waste (tons) 13,353 15,840 16,570 17,746 No goal
Net sales 155,866 171,511 156,060 179,950 1
1 Excluding Champion and AGES.