Volvo 1997 Annual Report Download - page 83
Download and view the complete annual report
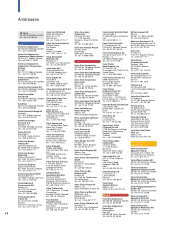
Please find page 83 of the 1997 Volvo annual report below. You can navigate through the pages in the report by either clicking on the pages listed below, or by using the keyword search tool below to find specific information within the annual report.-
 1
1 -
2
-
3
-
4
-
5
-
6
-
7
-
8
-
9
-
10
-
11
-
12
-
13
-
14
-
15
-
16
-
17
-
18
-
19
-
20
-
21
-
22
-
23
-
24
-
25
-
26
-
27
-
28
-
29
-
30
-
31
-
32
-
33
-
34
-
35
-
36
-
37
-
38
-
39
-
40
-
41
-
42
-
43
-
44
-
45
-
46
-
47
-
48
-
49
-
50
-
51
-
52
-
53
-
54
-
55
-
56
-
57
-
58
-
59
-
60
-
61
-
62
-
63
-
64
-
65
-
66
-
67
-
68
-
69
-
70
-
71
-
72
-
 73
73 -
 74
74 -
 75
75 -
 76
76 -
 77
77 -
 78
78 -
 79
79 -
 80
80 -
 81
81 -
 82
82 -
 83
83 -
 84
84 -
 85
85 -
 86
86 -
 87
87 -
 88
88 -
 89
89 -
 90
90 -
 91
91 -
 92
92 -
 93
93
 |
 |

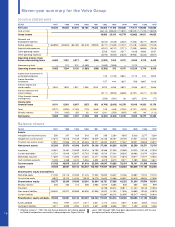
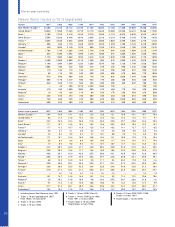
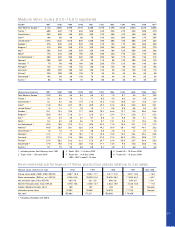
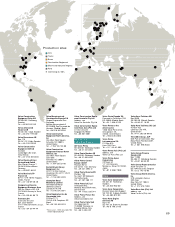
Effective in 1997, the Volvo Group’s accounting per market area reflects new geographical definitions based on an ISO standard. The accounting for the
years, 1991–1996, has been adjusted to conform with the new principle.
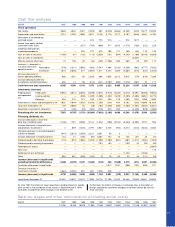
81
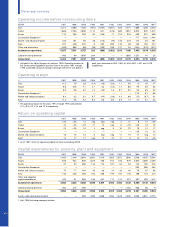
Research and developm ent expenses
SEKM 1987 1988 1989 1990 1991 1992 1993 1994 1995 1996 1997
Cars 2,925 3,478 4,329 4,851 3,895 3,346 2,462 2,502 4,561 4,901 5,055
Trucks 1,088 1,006 1,245 1,525 1,870 2,258 1,365 1,399 1,760 2,078 2,051
Buses 159 209 181 213 256 251 240 265 306 343 434
Construction Equipment — — — — — — — — 221 555 627
Marine- and industrial engines 128 124 127 178 180 166 154 148 177 183 213
Aero 95 100 151 150 163 194 196 160 150 155 205
Other 47 36 73 114 50 28 21 21 30 36 74
Automotive operations 4,442 4,953 6,106 7,031 6,414 6,243 4,438 4,495 7,205 8,251 8,659
Operations being divested 179 186 70 30 — — — 157 138 20 —
Group total 4,621 5,139 6,176 7,061 6,414 6,243 4,438 4,652 7,343 8,271 8,659
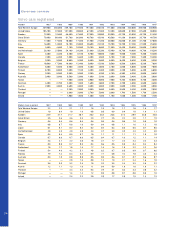
Net sales
SEKM 1987 1988 1989 1990 1991 1992 1993 1994 1995 1996 1997
Western Europe 46,072 50,658 56,200 71,763 86,056 90,322 101,444
Eastern Europe 560 927 1,385 1,636 2,222 2,794 3,939
Europe total 40,349 44,018 45,670 46,463 46,632 51,585 57,585 73,399 88,278 93,116 105,383
North America 21,134 22,978 26,218 21,398 18,285 19,828 31,364 37,034 39,011 36,560 51,052
South America 2,419 2,362 4,334 6,324 7,117 4,844 6,983
Asia 8,170 7,208 11,842 14,372 17,097 16,151 15,545
Other markets 5,897 8,024 9,786 10,802 1,717 2,019 2,074 2,799 2,993 3,546 4,596
Automotive operations 67,380 75,020 81,674 78,663 77,223 83,002 107,199 133,928 154,496 154,217 183,559
Operations being divested 25,140 21,619 9,298 4,522 — — 3,956 21,938 17,015 1,843 66
Group total 92,520 96,639 90,972 83,185 77,223 83,002 111,155 155,866 171,511 156,060 183,625
Of which Sweden 10,501 12,199 12,282 10,968 10,994 11,010 12,154 14,083 16,223 16,631 19,816
Figures for the years 1992 through 1996 have been adjusted to conform
with the new Annual Accounts Act.
Capital expenditures for property, plant and equipm ent
SEKM 1987 1988 1989 1990 1991 1992 1993 1994 1995 1996 1997
Sweden 2,768 2,589 4,424 2,943 2,046 2,046 2,788 2,208 3,918 5,586 6,800
Europe, excluding Sweden 517 580 1,081 1,320 583 502 438 432 871 1,655 1,475
North America 205 289 207 191 125 83 130 354 557 649 916
South America 8 416
Asia 28 214
Other markets 92 74 110 144 120 284 109 128 240 216 33
Automotive operations 3,582 3,532 5,822 4,598 2,874 2,915 3,465 3,122 5,586 8,142 9,854
Operations being divested 282 416 459 — — — — 1,152 905 58 9
Group total 3,864 3,948 6,281 4,598 2,874 2,915 3,465 4,274 6,491 8,200 9,863
Assets under operational leasing1— — 400 1,200 1,000 1,352 1,678 2,495 2,585 3,851 9,773
1 Until 1996 including company vehicles.
Market area statistics