Volvo 1997 Annual Report Download - page 72
Download and view the complete annual report
Please find page 72 of the 1997 Volvo annual report below. You can navigate through the pages in the report by either clicking on the pages listed below, or by using the keyword search tool below to find specific information within the annual report.-
 1
1 -
2
-
3
-
4
-
5
-
6
-
7
-
8
-
9
-
10
-
11
-
12
-
13
-
14
-
15
-
16
-
17
-
18
-
19
-
20
-
21
-
22
-
23
-
24
-
25
-
26
-
27
-
28
-
29
-
30
-
31
-
32
-
33
-
34
-
35
-
36
-
37
-
38
-
39
-
40
-
41
-
42
-
43
-
44
-
45
-
46
-
47
-
48
-
49
-
50
-
51
-
52
-
53
-
54
-
55
-
56
-
57
-
58
-
59
-
60
-
61
-
 62
62 -
 63
63 -
 64
64 -
 65
65 -
 66
66 -
 67
67 -
 68
68 -
 69
69 -
 70
70 -
 71
71 -
 72
72 -
 73
73 -
 74
74 -
 75
75 -
 76
76 -
 77
77 -
 78
78 -
 79
79 -
 80
80 -
 81
81 -
 82
82 -
83
-
84
-
85
-
86
-
87
-
88
-
89
-
90
-
91
-
92
-
93
 |
 |

70
Shareholder information
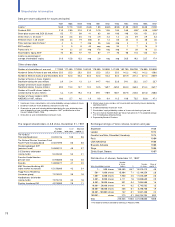
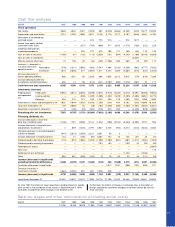
Data per share (adjusted for issues and splits)
1987 1988 1989 1990 1991 1992 1993 1994 1995 1996 1997
Income114.60 12.70 12.30 (2.60) 1.80 (8.60) (8.90) 31.80 20.20 26.90 22.90
Dividend, SEK 2.10 2.80 3.10 3.10 3.10 1.55 1.55 3.40 4.00 84.30 5.00 9
Share price at year-end, SEK (B share) 55 77 89 41 63 69 108 140 136 151 213
Direct return, % (B share) 23.8 3.6 3.5 7.6 4.9 2.3 1.4 2.4 2.9 2.9 2.3
Effective return, % (B share)3(18) 44 19 (50) 61 13 60 32 0 30 46
Price/ earnings ratio (B share)44 6 7 neg 36 neg neg 4 7 6 9
EBIT-multiple 52 5 8 45 neg neg 36 7 7 16 9
Payout ratio, %614 22 25 neg 176 neg neg 11 20 16 22
Shareholders’ equity, SEK775 86 97 91 87 77 70 98 110 125 137
Income as percentage of
average shareholders’ equity 21.0 15.8 13.3 neg 2.0 neg neg 36.5 19.3 23.7 17.4
Other share data
Number of shareholders at year-end 171,900 177,400 173,200 169,100 170,500 163,800 147,300 182,700 206,700 176,800 225,500
Number of Series A shares at year-end, millions 25.3 25.3 25.3 25.3 25.3 25.3 25.3 142.2 142.2 142.2 138.6
Number of Series B shares at year-end, millions 52.3 52.3 52.3 52.3 52.3 52.3 52.3 301.9 321.4 321.4 302.9
Number of Series A shares traded in
Stockholm during the year, millions 2.9 2.4 1.3 2.1 64.7 16.6 32.8 54.1 23.2 23.7 23.7
Number of Series B shares traded in
Stockholm during the year, millions 30.5 19.3 13.7 13.2 34.5 169.7 465.5 363.3 363.3 316.4 362.7
Number of A and B shares traded in
London during the year, millions n.a. 14.9 19.3 11.0 89.1 178.9 150.7 287.5 232.8 301.0 260.8
Number of shares traded in ADR,
NASDAQ in 1997, millions 10.6 5.7 4.6 1.9 9.9 9.4 11.5 19.0 73.5 83.0 47.1
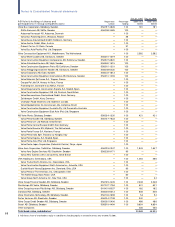
The largest shareholders in AB Volvo, Decem ber 31, 1997
Number % of Share of
of shares total votes capital, %
The funds of
FöreningsSparbanken 43,202,746 10.5 9.8
The National Pension Insurance Fund,
Fourth Fund managing board 22,047,590 8.6 5.0
Försäkringsbolaget SPP
(pensions funds) 16,509,912 4.8 3.7
S-E-Bankens aktiefonder
(saving funds) 9,449,335 5.3 2.1
Svenska Handelsbanken
pension fund 8,700,000 5.2 2.0
Skandia 13,009,877 4.7 2.9
AMF Pensionsförsäkring AB
(labor market insurances) 15,150,000 4.2 3.4
Trygg-Hansa Försäkring
(insurance group) 7,979,922 3.8 1.8
Nordbankens aktiefonder
(saving funds) 7,975,725 3.3 1.8
Parcitas Investment SA 4,975,000 2.9 1.1
1 Income per share is calculated as net income divided by average number of shares.
2 Dividend in SEK per share, divided by share price at year-end.
3 Share price at year-end, including dividend paid during the year, divided by share
price at beginning of year, including redemption 1997 and distribution of one
share of Swedish Match 1996.
4 Share price at year-end divided by income per share.
5 Market value at year-end plus net financial debt and minority interest, divided by
operating income.
6 Dividend divided by income per share.
7 Shareholders’ equity divided by number of shares outstanding at year-end.
8 Plus one share of Swedish Match per Volvo share, price of 21.74 (weighted average
first 10 trading days following listing).
9 Proposed by Board of Directors.
Exchange listings of Volvo shares, location and year
Stockholm 1935
London 1972
Frankfurt am Main, Düsseldorf, Hamburg 1974
Paris 1984 1
USA (NASDAQ) 1985
Brussels, Antwerp 1985
Tokyo 1986
Zürich, Basel, Geneva 1987 1
Distribution of shares, Decem ber 31, 1997
Number
of share- Number Share of
Volvo shareholders owning holders % of shares capital, %
1– 500 shares 195,409 86.7 19,913,413 4.5
501– 1,000 shares 15,984 7.1 12,199,259 2.8
1,001– 2,000 shares 7,960 3.5 11,626,389 2.6
2,001– 5,000 shares 4,111 1.8 12,850,685 2.9
5,001– 10,000 shares 991 0.4 7,054,585 1.6
10,001– 20,000 shares 411 0.2 5,793,582 1.3
20,001– 50,000 shares 265 0.1 8,290,788 1.9
50,001–100,000 shares 132 0.1 9,557,480 2.2
100,001– shares 273 0.1 354,234,704 80.2
Total 225,536 100.0 441,520,885 100.0
1 The Board of Directors decided on delisting in February 1998.