Volvo 1997 Annual Report Download - page 17
Download and view the complete annual report
Please find page 17 of the 1997 Volvo annual report below. You can navigate through the pages in the report by either clicking on the pages listed below, or by using the keyword search tool below to find specific information within the annual report.-
 1
1 -
2
-
3
-
4
-
5
-
6
-
 7
7 -
 8
8 -
 9
9 -
 10
10 -
 11
11 -
 12
12 -
 13
13 -
 14
14 -
 15
15 -
 16
16 -
 17
17 -
 18
18 -
 19
19 -
 20
20 -
 21
21 -
 22
22 -
 23
23 -
 24
24 -
 25
25 -
 26
26 -
 27
27 -
28
-
29
-
30
-
31
-
32
-
33
-
34
-
35
-
36
-
37
-
38
-
39
-
40
-
41
-
42
-
43
-
44
-
45
-
46
-
47
-
48
-
49
-
50
-
51
-
52
-
53
-
54
-
55
-
56
-
57
-
58
-
59
-
60
-
61
-
62
-
63
-
64
-
65
-
66
-
67
-
68
-
69
-
70
-
71
-
72
-
73
-
74
-
75
-
76
-
77
-
78
-
79
-
80
-
81
-
82
-
83
-
84
-
85
-
86
-
87
-
88
-
89
-
90
-
91
-
92
-
93
 |
 |

15
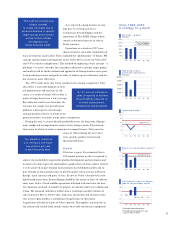
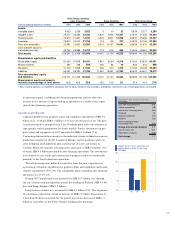
The operating margin for the Group developed favorably during the year and
amounted to 4.6% for the full year and 5% for the fourth quarter isolated.
Incom e from investm ents in associated com panies
Income from investments in associated companies amounted to SEK 2,929 M
(314). The gain on the sale of the shareholding in Pripps Ringnes AB was SEK
3,027 M. Volvo’s share of the loss in NedCar was SEK 128 M. Income from
investments in associated companies active in sales financing was charged with
credit losses in the Brazilian operations and the total loss amounted to SEK 146 M.
Incom e from other investm ents
Income from other shares and participations, SEK 1,168 M (9,007) included a
gain of SEK 783 M on the sale of Renault shares and SEK 221 M from the sale
of SAS Sverige shares. The dividend from Pharmacia & Upjohn amounted to
SEK 165 M. Income in 1996 includes gain on the sale of shares in Pharmacia &
Upjohn of SEK 7,766 M.
Net interest income
Net interest income, SEK 738 M (1,546) was lower than in 1996. The lower
return was attributable to declining interest rates and the fact that liquid funds
were to a large extent invested in interest-bearing papers with short maturities.
Tax expense
Tax expenses pertained mainly to current taxes in foreign subsidiaries.
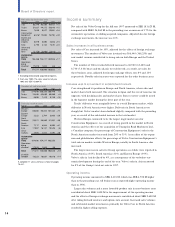
Consolidated income statements 1995 1996 1997
Net sales 171,511 156,060 183,625
Cost of sales (128,529) (121,249) (138,990)
Gross income 42,982 34,811 44,635
Research and development expenses (7,343) (8,271) (8,659)
Selling expenses (17,418) (14,895) (17,160)
Administrative expenses (7,399) (6,685) (7,018)
Other operating income 4,168 5,086 3,187
Other operating expenses (5,966) (6,336) (6,567)
Operating income before
nonrecurring items 9,024 3,710 8,418
Nonrecurring items 1,215 — —
Operating income 10,239 3,710 8,418
Income from investments
in associated companies 2,119 314 2,929
Income from other investments 788 9,007 1,168
Interest income and similar credits 3,996 4,817 3,486
Interest expenses and similar charges (3,757) (3,271) (2,748)
Other financial income and expenses (337) (374) (77)
Income after financial items 13,048 14,203 13,176
Taxes (3, 741) (1,825) (2,705)
Minority interests (45) 99 (112)
Net income 9,262 12,477 10,359
Income in SEK per share 20.20 26.90 22.90
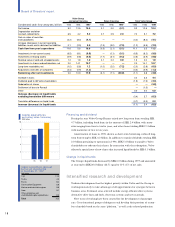
Operating incom e (loss) before non-
recurring items, by business area
SEKM 1995 1996 1997
Cars 1,089 1,498 4,510
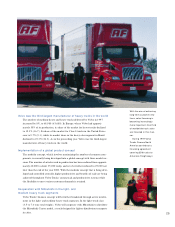
Trucks 5,073 878 1,812
Buses 405 331 550
Construction
Equipment 717 11,162 1,444
Marine and
industrial engines 212 (27) 181
Aero 103 153 472
Other and
eliminations (106) (376) (577)
Automotive
operations 7,493 3,619 8,392
Operations being
divested 1,531 91 26
Total 9,024 3,710 8,418
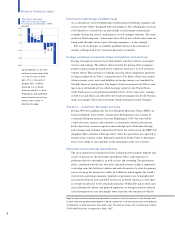
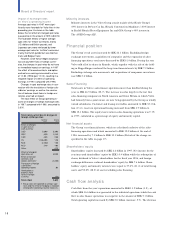
Factors that affected
operating incom e
SEK billion 1997
Operating income from
automotive operations 1996 3.6
Increased volume
and profit margins 2.1
Change in product mix,
Volvo 400 to S40 and V40 0.9
Higher research and
development expenses (0.3)
Higher selling expenses (1.6)
Acquired companies 0.3
Effect of changes in
foreign exchange rates 2.6
Other 0.8
Operating income, automotive
operations 8.4
1 From July 1995. Operating income for full year
1995 was SEK 1,679 M.
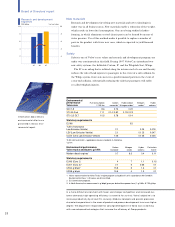
Condensed incom e statements,
sales financing
SEKM 1995 1996 1997
Net sales 4,295 5,101 5,956
Operating Income 82 146 202
Income from
investments in
associated companies 98 6 (146)
Financial income
and expenses 8 (16) 1
Income after
financial items 188 136 57