Volvo 1997 Annual Report Download - page 52
Download and view the complete annual report
Please find page 52 of the 1997 Volvo annual report below. You can navigate through the pages in the report by either clicking on the pages listed below, or by using the keyword search tool below to find specific information within the annual report.-
 1
1 -
2
-
3
-
4
-
5
-
6
-
7
-
8
-
9
-
10
-
11
-
12
-
13
-
14
-
15
-
16
-
17
-
18
-
19
-
20
-
21
-
22
-
23
-
24
-
25
-
26
-
27
-
28
-
29
-
30
-
31
-
32
-
33
-
34
-
35
-
36
-
37
-
38
-
39
-
40
-
41
-
 42
42 -
 43
43 -
 44
44 -
 45
45 -
 46
46 -
 47
47 -
 48
48 -
 49
49 -
 50
50 -
 51
51 -
 52
52 -
 53
53 -
 54
54 -
 55
55 -
 56
56 -
 57
57 -
 58
58 -
 59
59 -
 60
60 -
 61
61 -
 62
62 -
63
-
64
-
65
-
66
-
67
-
68
-
69
-
70
-
71
-
72
-
73
-
74
-
75
-
76
-
77
-
78
-
79
-
80
-
81
-
82
-
83
-
84
-
85
-
86
-
87
-
88
-
89
-
90
-
91
-
92
-
93
 |
 |
■■
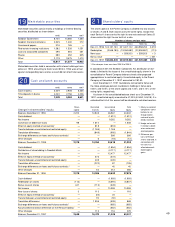
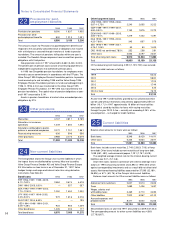
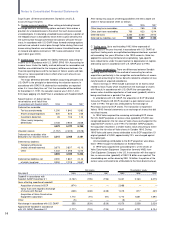
22 Provisions for post-
em ployment benefits
1995 1996 1997
Provisions for pensions 6,090 1,937 1,905
Provisions for other
postemployment benefits 800 1,213 1,391
Total 6,890 3,150 3,296
The amounts shown for Provisions for postemployment benefits cor-
respond to the actuarially calculated value of obligations not insured
with a third party or secured through transfers of funds to pension
foundations. The amount of pensions falling due within one year is
included. The Swedish Group companies have insured their pension
obligations with third parties.
Group pension costs in 1997 amounted to 3,660 (3,446; 3,030).
The greater part of pension costs consist of continuing payments to
independent organizations that administer pension plans.
In 1996 two Groupwide pension foundations for employees were
formed to secure commitments in accordance with the ITP plan. The
Volvo Group 1995 Employee Pension Foundation pertains to pension
funds earned up to and including 1995 and the Volvo Group 1996
Employee Pension Foundation pertains to funds earned beginning in
1996. In 1996, 4,244 was transferred to the Volvo Group 1995
Employee Pension Foundation. In 1997 396 was transferred to the
pension foundations. The capital value of pension obligations at year-
end 1997 amounted to 5,141.
Assets in pension foundations at market value, exceeded pension
obligations by 315.
■■
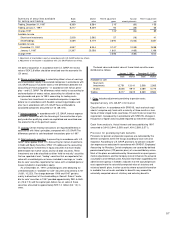
23 Other provisions
1995 1996 1997
Warranties 4,137 4,811 5,769
Allocations in insurance
operations 1,449 1,650 1,890
Allocations attributable to partici-
pations in associated companies 2,072 1,701 1,851
Restructuring measures 606 596 556
Other provisions 2,988 3,175 5,679
Total 11,252 11,933 15,745
■■
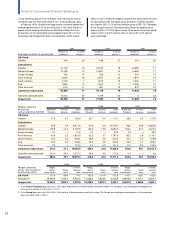
24 Non-current liabilities
The listing below shows the Group’s non-current liabilities in which
the largest loans are distributed by currency. Most are issued by
Volvo Group Finance Sweden AB and Volvo Group Finance Europe
BV. Information on loan terms is as of December 31, 1997. Volvo
hedges foreign-exchange and interest-rate risks using derivative
instruments. See Note 30.
Bond loans 1995 1996 1997
FRF 1994-1997/ 1999–2009,
6.12–7.62% 2,584 3,674 4,618
DKK 1996/ 2005, 6.00% — 357 357
SEK 1992–1997/ 1999–2002,
7.70–12.50% 1,050 1,450 1,300
JPY 1995–1997/ 1999–2005,
0.29–5.00% 972 1,316 3,216
NLG 1997/ 2004, 6.60% — — 195
USD 1994–1996/ 1999–2001,
6.06–7.38% 934 955 1,409
Other bond loans 1,435 203 177
Total bond loans 6,975 7,955 11,272
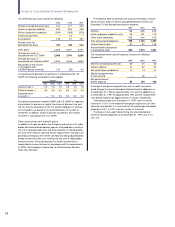
Other long-term loans 1995 1996 1997
USD 1995–1997/ 1999–2006,
5.87–10.75% 2,240 2,655 3,222
GBP 1989–1997/ 1999–2007,
5.80–9.30% 1,153 1,875 2,273
DEM 1993–1997/ 1999–2005,
3.84–7.50% 1,319 1,442 1,491
NLG 1995–1997/ 1999–2003,
4.20–7.68% 343 857 575
SEK 1995–1997/ 1999–2007,
4.75–11.05% 50 50 1,400
CAD 1995/ not confirmed, 7.85% 252 258 281
Other loans 4,553 3,097 2,621
Total other long-term loans 9,910 10,234 11,863
Total 16,885 18,189 23,135
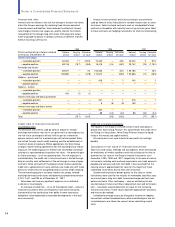
Of the above long-term borrowing, 2,992 (1,109; 780) was secured.
Long-term debt matures as follows:
1999 6,223
2000 5,660
2001 1,703
2002 1,749
2003 425
2004 or later 7,375
Total 23,135
At year-end 1997 credit facilities granted but not utilized and which
can be used without restrictions amounted to approximately SEK 22
billion (16; 17). In 1997 approximately 16 billion of these facilities
consisted of stand-by facilities for loans with varying maturities
through the year 2003. A fee – normally not exceeding 0.25% of the
unused portion – is charged for credit facilities.
■■
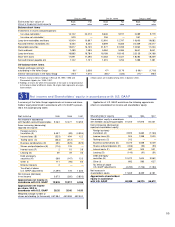
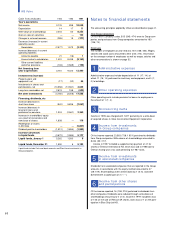
25 Current liabilities
Balance sheet amounts for loans were as follows:
1995 1996 1997
Bank loans 6,346 8,429 14,411
Other loans 5,345 5,834 3,871
Total 11,691 14,263 18,282
Bank loans include current maturities, 2,748 (2,082;1,706), of long-
term debt. Other loans include current maturities of long-term debt,
1,498 (651; 482), and commercial papers, 1,291 (1,757; 4,518).
The weighted average interest rate for the interest-bearing current
liabilities was 5.0% (5.1; 6.6).
Short-term loans raised in connection with interest arbitrage trans-
actions in 1995 amounting to 5,642 and 2,893 in 1996 were offset
against corresponding investments and as a result did not affect total
assets. Noninterest-bearing liabilities accounted for 37,595 (32,189;
36,826), or 67% (69; 76) of the Group’s total current liabilities.
Balance sheet amounts for Other current liabilities were as follows:
1995 1996 1997
Advances from customers 2,627 2,514 2,603
Taxes 1,689 1,436 1,637
Wages, salaries and
withholding taxes 3,469 3,710 3,690
Other liabilities 7,922 5,967 6,102
Accrued expenses and
prepaid income 8,417 6,602 8,306
Total 24,124 20,229 22,338
Secured bank loans at year-end 1997 amounted to 2,369 (641;443)
The corresponding amount for other current liabilities was 4,563
(2,778;3,657).
50
Notes to Consolidated Financial Statements