Volvo 1997 Annual Report Download - page 7
Download and view the complete annual report
Please find page 7 of the 1997 Volvo annual report below. You can navigate through the pages in the report by either clicking on the pages listed below, or by using the keyword search tool below to find specific information within the annual report.-
 1
1 -
 2
2 -
 3
3 -
 4
4 -
 5
5 -
 6
6 -
 7
7 -
 8
8 -
 9
9 -
 10
10 -
 11
11 -
 12
12 -
 13
13 -
 14
14 -
 15
15 -
 16
16 -
 17
17 -
 18
18 -
19
-
20
-
21
-
22
-
23
-
24
-
25
-
26
-
27
-
28
-
29
-
30
-
31
-
32
-
33
-
34
-
35
-
36
-
37
-
38
-
39
-
40
-
41
-
42
-
43
-
44
-
45
-
46
-
47
-
48
-
49
-
50
-
51
-
52
-
53
-
54
-
55
-
56
-
57
-
58
-
59
-
60
-
61
-
62
-
63
-
64
-
65
-
66
-
67
-
68
-
69
-
70
-
71
-
72
-
73
-
74
-
75
-
76
-
77
-
78
-
79
-
80
-
81
-
82
-
83
-
84
-
85
-
86
-
87
-
88
-
89
-
90
-
91
-
92
-
93
 |
 |
Aero reported a sharp increase in earn-
ings, due to a strong increase in
Commercial Aircraft Engines and the
acquisition of The AGES Group, which
caused a substantial increase in sales in
North America.
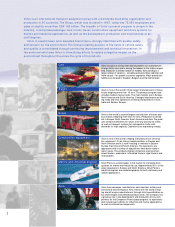
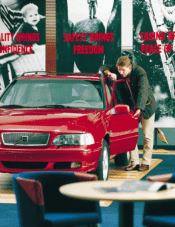
Operations as a whole in 1997 were
characterized by successful exploitation of
basic investments made earlier. These included the “globalization” of Trucks’ FH
concept and the further development of the Volvo 850 to create the Volvo S70
and V70 in various configurations. This method of employing a basic concept – a
platform – to create a broader line of products directed to specific target groups
and markets will be further refined and applied in all Group business areas, part-
ly for marketing reasons and partly in order to achieve greater efficiency and uti-
lize resources more effectively.
The 1997 results show that Volvo’s products are strongly competitive. They
also reflect a successful program of inter-
nal improvement and increases in effi-
ciency, as a result of which Volvo today is
much stronger than it was a few years ago.
But while the results were favorable, the
outcome for a single year provides poor
guidance with respect to the Group’s
strategic position relative to trends in the
general economy, to market trends and to competitors.
During the year, to ensure durable profitability over the long term, Manage-
ment conducted a comprehensive review of the Group’s needs. This showed
three areas in which, in order to maintain its competitiveness, Volvo must in-
crease its efforts during the next three
years; growth, product renewal and
operating efficiency.
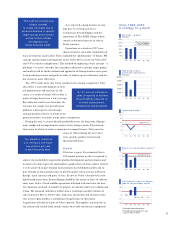
Growth
Volvo has to grow. It is estimated that a
10% annual increase in sales is required to
achieve the profitability required for product development and investments and
in order to be able to give the shareholders a good return on their capital. Growth
is to be achieved in part through increased sales in established markets and in
part through an increased presence in growth markets such as those in Eastern
Europe, Latin America and parts of Asia. In view of Volvo’s already well estab-
lished brand name there, Eastern Europe should be the easiest of these to cultivate
short term. Volvo’s Truck and Bus operations in Poland will constitute the base
for expansion eastward. A number of projects are already under way in India and
China. The financial turbulence in East Asia is resulting in smaller volumes of
sales at present. But we believe that, long term, the growth and customer struc-
ture in the region justifies a continuing strong presence in this region.
Acquisitions will also be a part of Volvo’s growth. This applies, in particular, to
the commercial-vehicle field, mainly trucks, buses and construction equipment.
5
“ The m ethod of em ploying
a basic concept
to create a broader line of
products directed to specific
target groups and markets
will be further refined
and applied in all
Group business areas.”
“A 10% annual increase in
sales is required to achieve
the profitability required for
product development,
investm ents and dividends.”
“ Our am bition, therefore,
is to introduce one m ajor
new product per year
in each business area.”
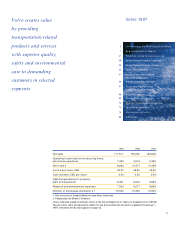
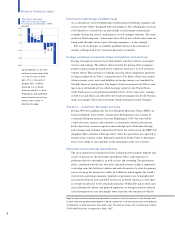
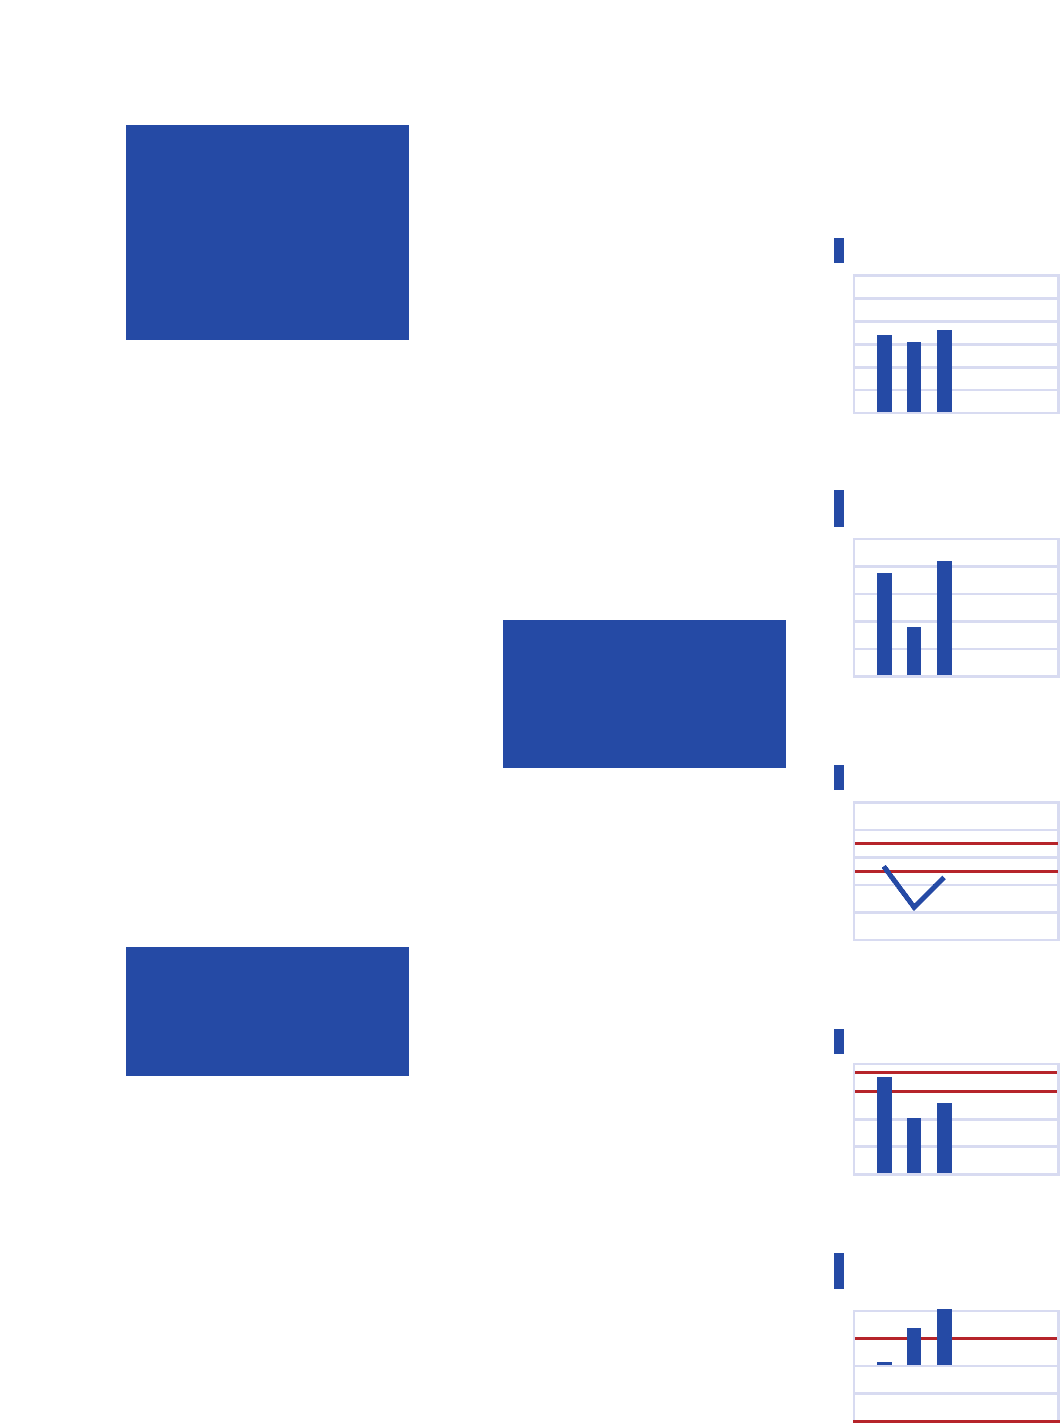
Operating incom e,
autom otive operations 1
SEK million
4,000
2,000
10,000
6,000
8,000
95 96 97 98 00
99
Net financial assets, as percen-
tage of shareholders’ equity
%
objective 12–15 %
95 96 97 98 00
99
95 96 97 98 00
99
4
2
10
6
8
objective 5–7%
Operating margin 1
%
95 96 97 98 00
99
Net sales – growth
SEK billion
10 0
50
95 96 97 98 00
300
15 0
99
200
250 Objective: Net sales in
the year 2000 will
exceed SEK 250 billion
Return on shareholders’ equity 2
%
8
2
12
16
0
–15 objective -30% — +15%
15
30
–30
Volvo 1998–2000
A strategy for growth
1 Excluding nonrecurring items.
2 Excluding nonrecurring items and
gain on sales of shares.