Volvo 1997 Annual Report Download - page 48
Download and view the complete annual report
Please find page 48 of the 1997 Volvo annual report below. You can navigate through the pages in the report by either clicking on the pages listed below, or by using the keyword search tool below to find specific information within the annual report.-
 1
1 -
2
-
3
-
4
-
5
-
6
-
7
-
8
-
9
-
10
-
11
-
12
-
13
-
14
-
15
-
16
-
17
-
18
-
19
-
20
-
21
-
22
-
23
-
24
-
25
-
26
-
27
-
28
-
29
-
30
-
31
-
32
-
33
-
34
-
35
-
36
-
37
-
 38
38 -
 39
39 -
 40
40 -
 41
41 -
 42
42 -
 43
43 -
 44
44 -
 45
45 -
 46
46 -
 47
47 -
 48
48 -
 49
49 -
 50
50 -
 51
51 -
 52
52 -
 53
53 -
 54
54 -
 55
55 -
 56
56 -
 57
57 -
 58
58 -
59
-
60
-
61
-
62
-
63
-
64
-
65
-
66
-
67
-
68
-
69
-
70
-
71
-
72
-
73
-
74
-
75
-
76
-
77
-
78
-
79
-
80
-
81
-
82
-
83
-
84
-
85
-
86
-
87
-
88
-
89
-
90
-
91
-
92
-
93
 |
 |

46
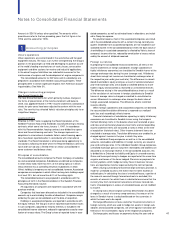
Notes to Consolidated Financial Statements
■■
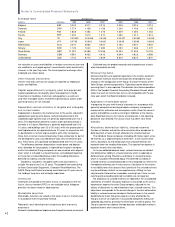
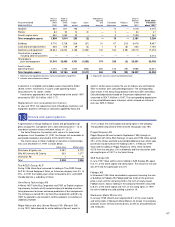
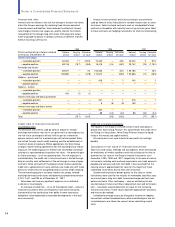
10 Ta x e s
Income after financial items was distributed as follows:
1995 1996 1997
Sweden 4,449 10,476 8,828
Outside Sweden 7,197 3,437 4,464
Share of income of
associated companies 1,402 290 (116)
Total 13,048 14,203 13,176
Tax expense was distributed as follows:
1995 1996 1997
Current taxes:
Sweden (18) (615) (133)
Outside Sweden (2,400) (1,532) (2,145)
Subtotal (2,418) (2,147) (2,278)
Deferred taxes:
Sweden (176) 574 (366)
Outside Sweden (475) (184) 42
Subtotal (651) 390 (324)
Associated companies (672) (68) (103)
Total taxes (3,741) (1,825) (2,705)
Tax expense pertains mainly to current taxes in foreign subsidiaries.
The sale of the shareholding in Renault resulted in a tax-deductible
loss that reduced Group tax expense by slightly more than 500.
Provision has been made for estimated tax charges that may arise
as a result of tax audits in the Volvo Group. Deductions claimed for
which no provision has been deemed necessary are equal an ex-
pense of approximately 699 (528; 940). This amount is included
among contingent liabilities.
Deferred taxes pertain mainly to an estimated tax on the change
in untaxed reserves, taking into account tax-loss carryforwards and
temporary differences.
At December 31, 1997, the Group had tax-loss carryforwards
amounting to approximately 4,900. Of this amount, approximately
2,400 has been recognized in calculating deferred tax liabilities.
Tax-loss carryforwards amounting to approximately 2,500 can thus
be utilized to reduce tax expense in future years and are attributable
to companies outside Sweden. Of this amount, 900 expires within
five years. Tax-loss carryforwards in Sweden are not restricted time-
wise.
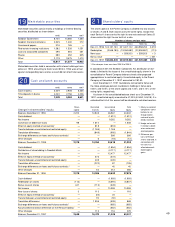
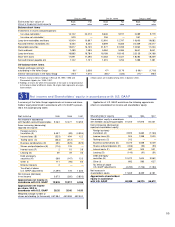
The Swedish corporate income tax rate is 28%. The table below
shows the principal reason for the difference between this rate and
the Group’s tax rate, based on income after financial items
1995, % 1996, % 1997, %
Swedish corporate income tax rate 28 28 28
Difference in tax rate
in various countries 4 1 2
Capital gains (losses) (8) (22) (13)
Utilization of tax-loss carryforwards (7) (4) (2)
Losses for which no benefit
has been recognized 1 8 2
Non deductable expenses 3 3 2
Amortization of goodwill 5 0 0
Other, net 1 (1) 1
Tax rate for the Group, excluding
equity method 27 13 20
Equity method 2 0 1
Tax rate for the Group 29 13 21
■■
11 Minority interests
Minority interests in income (loss) and in equity consist mainly of
Henlys Group’s participation in Prévost Car Inc. (49%), Hitachi
Construction Machinery Company’s participation in Euclid-Hitachi
Heavy Equipment Inc. (40%), GPA Group’s minority interests in The
AGES Group, ALP (40%) and up to and including June 1997,
General Motors’ holding in Volvo Trucks North America Corporation
(13%).
■■
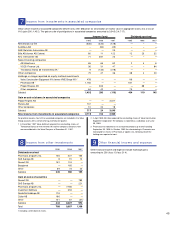
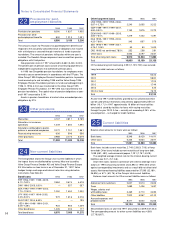
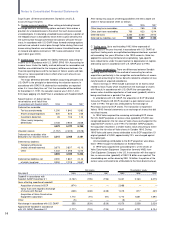
12 Intangible and tangible assets
Value in Value in Subsidiaries Value in
balance balance acquired balance
sheet sheet Invest- Sales/ and Translation Reclassi- sheet
Acquisition cost 1995 1996 ments scrapping divested differences fications 1997
Goodwill 6,251 2,974 — — 1,083 36 — 4,093
Patents 161 102 13 (2) 3 (5) — 111
Aircraft engine costs 1,108 1,115 88 — 42 16 — 1,261
Total intangible assets 7,520 4,191 101 (2) 1,128 47 — 5,465
Buildings 14,065 13,166 1,173 (84) 29 175 516 14,975
Land and land improvements 2,391 2,116 117 (40) 3 54 49 2,299
Machinery and equipment 137,713 38,782 6,453 (2,350) 178 330 3,104 46,497
Construction in progress
including advance payments 2,840 4,860 2,019 (2) — 43 (3,847) 3,073
Total property, plant and equipment 57,009 58,924 9,762 (2,476) 210 602 (178) 66,844
Assets under operating leases 3,917 6,698 9,773 (1,896) 1,303 665 (56) 16,487
Total tangible assets 60,926 65,622 19,535 (4,372) 1,513 1,267 (234) 83,331