Volvo 1997 Annual Report Download - page 80
Download and view the complete annual report
Please find page 80 of the 1997 Volvo annual report below. You can navigate through the pages in the report by either clicking on the pages listed below, or by using the keyword search tool below to find specific information within the annual report.-
 1
1 -
2
-
3
-
4
-
5
-
6
-
7
-
8
-
9
-
10
-
11
-
12
-
13
-
14
-
15
-
16
-
17
-
18
-
19
-
20
-
21
-
22
-
23
-
24
-
25
-
26
-
27
-
28
-
29
-
30
-
31
-
32
-
33
-
34
-
35
-
36
-
37
-
38
-
39
-
40
-
41
-
42
-
43
-
44
-
45
-
46
-
47
-
48
-
49
-
50
-
51
-
52
-
53
-
54
-
55
-
56
-
57
-
58
-
59
-
60
-
61
-
62
-
63
-
64
-
65
-
66
-
67
-
68
-
69
-
 70
70 -
 71
71 -
 72
72 -
 73
73 -
 74
74 -
 75
75 -
 76
76 -
 77
77 -
 78
78 -
 79
79 -
 80
80 -
 81
81 -
 82
82 -
 83
83 -
 84
84 -
 85
85 -
 86
86 -
 87
87 -
 88
88 -
 89
89 -
 90
90 -
91
-
92
-
93
 |
 |

78
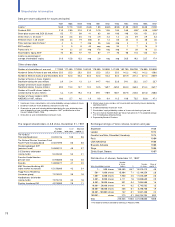
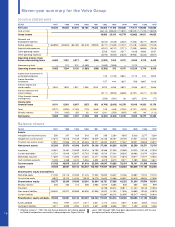
Key ratios
1987 1988 1989 1990 1991 1992 1993 1994 1995 1996 1997
Gross margin, %120.3 22.8 26.2 25.1 22.3 24.3
Research- and development
expenses as percentage of net sales17.5 4.0 3.0 4.3 5.3 4.7
Selling expenses as percentages of net sales110.5 10.3 10.1 10.2 9.5 9.3
Administrative expenses as
percentages of net sales15.0 5.5 4.9 4.3 4.3 3.8
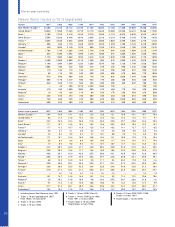
Operating margin, % 7.0 7.5 5.6 (2.3) (1.1) (4.0) 0.3 6.0 6.0 2.4 4.6
Return on shareholders’ equity, % 21.0 15.8 13.3 neg 2.0 neg neg 36.5 19.3 23.7 17.4
Interest coverage, times 5.4 5.3 3.6 0.9 1.1 0.2 0.6 5.5 4.6 5.5 5.8
Self-financing ratio, % 243 99 88 18 57 78 165 181 122 29 59
Net financial assets (net debt), SEK M 5,583 (1,610) (3,011) (9,256) (11,357) (18,117) (20,592) (5,999) 1,245 12,007 19,108
Net financial assets (net debt) as
percentage of shareholders’ equity
and minority interests 18.8 (4.8) (7.9) (26.0) (29.2) (53.9) (61.0) (13.6) 2.4 20.6 31.2
Shareholders’ equity and minority
interests as percentage of total assets 37.9 38.8 38.8 34.9 36.4 28.8 25.1 31.9 37.4 41.4 37.6
Shareholders’ equity and minority interests,
as percentage of total assets
excluding sales financing, % 234.5 40.8 48.0 50.8
Shareholders’ equity as percentage
of total assets 37.5 38.2 38.4 34.6 31.7 25.4 20.1 31.3 36.9 41.0 37.0
Excluding nonrecurring operating items and gain on sales of shares
Operating margin, % 7.0 7.3 5.3 0.7 (1.1) (2.3) 1.7 6.0 5.3 2.4 4.6
Return on shareholders’ equity, % 16.6 15.3 13.3 3.6 neg neg 4.1 24.2 14.7 8.1 10.4
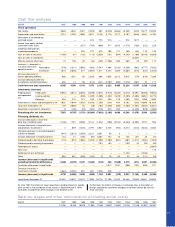
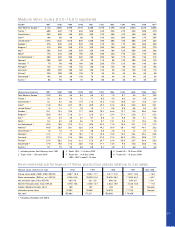
Exports from Sweden
SEK M 1987 1988 1989 1990 1991 1992 1993 1994 1995 1996 1997
Volvo Group, total 29,319 30,151 32,181 32,182 31,881 30,344 36,130 43,330 56,059 54,589 51,872
Business area statistics
Num ber of employees at year-end
Number 1987 1988 1989 1990 1991 1992 1993 1994 1995 1996 1997
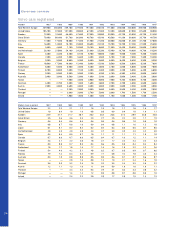
Cars 34,050 34,280 34,610 33,630 29,570 28,450 26,800 29,080 31,050 29,600 27,920
Trucks 18,490 21,460 22,310 20,550 20,290 19,480 17,780 19,790 21,670 21,160 22,520
Buses 810 2,800 2,810 3,690 3,050 2,620 2,610 2,600 3,620 3,750 4,220
Construction Equipment — — — — — — — — 7,610 7,300 8,560
Marine and industrial engines 2,650 2,620 2,550 2,190 2,040 1,540 1,420 1,540 1,570 1,420 1,400
Aero 3,550 3,760 3,800 4,000 4,420 4,290 4,040 3,770 3,890 3,740 4,170
Other 6,500 4,160 4,310 4,740 4,210 3,740 3,350 2,350 2,600 3,350 4,110
Automotive operations 66,050 69,080 70,390 68,800 63,580 60,120 56,000 59,130 72,010 70,320 72,900
Operations being divested, etc 9,300 9,530 8,300 — — — 17,640 16,420 7,040 10 —
Group total 75,350 78,610 78,690 68,800 63,580 60,120 73,640 75,550 79,050 70,330 72,900
Eleven-year summary
1. Key ratios are stated in accordance with the new 1997 Annual
Accounts Act. Figures for the years 1992 through 1996 have been
adjusted to conform with the new principle.
2. Sales-financing operations had a marginal effect on the percentage of
risk capital and minority capital prior to 1994.