Volvo 1997 Annual Report Download - page 19
Download and view the complete annual report
Please find page 19 of the 1997 Volvo annual report below. You can navigate through the pages in the report by either clicking on the pages listed below, or by using the keyword search tool below to find specific information within the annual report.-
 1
1 -
2
-
3
-
4
-
5
-
6
-
7
-
8
-
 9
9 -
 10
10 -
 11
11 -
 12
12 -
 13
13 -
 14
14 -
 15
15 -
 16
16 -
 17
17 -
 18
18 -
 19
19 -
 20
20 -
 21
21 -
 22
22 -
 23
23 -
 24
24 -
 25
25 -
 26
26 -
 27
27 -
 28
28 -
 29
29 -
30
-
31
-
32
-
33
-
34
-
35
-
36
-
37
-
38
-
39
-
40
-
41
-
42
-
43
-
44
-
45
-
46
-
47
-
48
-
49
-
50
-
51
-
52
-
53
-
54
-
55
-
56
-
57
-
58
-
59
-
60
-
61
-
62
-
63
-
64
-
65
-
66
-
67
-
68
-
69
-
70
-
71
-
72
-
73
-
74
-
75
-
76
-
77
-
78
-
79
-
80
-
81
-
82
-
83
-
84
-
85
-
86
-
87
-
88
-
89
-
90
-
91
-
92
-
93
 |
 |

17
in operating capital, excluding sales-financing operations, did not offset the
increase in the amount of capital tied up in operations as a result of the expan-
sion of sales-financing operations.
Capital expenditures
Capital expenditures for property, plant and equipment amounted to SEK 9.9
billion (8.2), of which SEK 5.5 billion (4.4) were investments in Cars. The grea-
ter part pertained to changeovers in Cars’ Torslanda plant and to investments in
type-specific tools in preparation for future models. Trucks’ investments in pro-
perty, plant and equipment in 1997 amounted to SEK 2.4 billion (2.6).
Continuing substantial investments in the industrial system included increases in
production capacity for the D12 engine in Skövde, and for gearboxes and rear
axles in Köping and Lindesberg, plus construction of a new cab factory in
Curitiba, Brazil. Investments in leasing assets amounted to SEK 9.8 billion (3.9),
of which SEK 9.3 billion pertained to sales-financing operations. The investments
were related to cars, trucks and construction equipment and were attributable
primarily to the North American operations.
The self-financing ratio, defined as cash flow from the year’s operations as
a percentage of capital expenditures for property, plant and equipment and leasing
vehicles, amounted to 59% (29). The comparable figure excluding sales-financing
operations was 161% (63).
During 1997 liquid funds were increased by SEK 10.7 billion, net, through
the sale of shares and participations mainly the holdings in Renault, SEK 5.9 bil-
lion, and Pripps Ringnes, SEK 4.5 billion.
Long-term receivables, net, increased by SEK 6.0 billion (2.8). The expansion
of sales-finance operations caused an increase of SEK 7.2 billion. Repayment of
a loan from NedCar accounted for the greater part of the decrease of SEK 1.2
billion in receivables in the Volvo Group excluding sales financing.
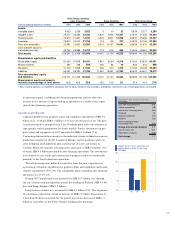
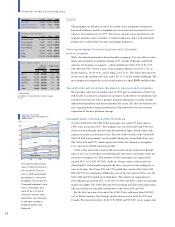
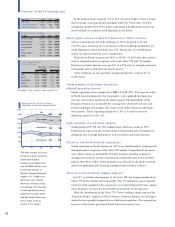
Volvo Group excluding
sales financing1Sales financing Total Volvo Group
Consolidated balance sheets 1995 1996 1997 1995 1996 1997 1995 1996 1997
Assets
Intangible assets 5,623 2,258 3,262 31922 5,626 2,277 3,284
Tangible assets 25,071 26,480 32,043 2,870 4,946 12,251 27,941 31,426 44,294
Financial assets 25,970 21,851 14,233 4,933 6,821 14,508 28,991 25,668 24,527
Inventories 23,813 23,042 27,756 116 106 237 23,929 23,148 27,993
Short-term receivables 22,591 21,822 23,553 6,315 10,157 19,041 28,906 31,979 42,594
Cash and bank accounts,
marketable securities 23,133 25,986 19,737 173 675 866 23,306 26,661 20,603
Total assets 126,201 121,439 120,584 14,410 22,724 46,925 138,699 141,159 163,295
Shareholders’ equity and liabilities
Shareholders’ equity 51,200 57,876 60,431 1,912 3,004 4,214 51,200 57,876 60,431
Minority interests 351 448 859 254 56 40 605 504 899
Provisions 21,209 17,825 21,534 283 313 1,419 21,492 18,138 22,953
Liabilities 53,441 45,290 37,760 11,961 19,351 41,252 65,402 64,641 79,012
Total shareholders’ equity
and liabilities 126,201 121,439 120,584 14,410 22,724 46,925 138,699 141,159 163,295
Shareholders’ equity and minority
interests as percentage of total assets 40.8 48.0 50.8 15.0 13.5 9.1 37.4 41.4 37.6
1 Sales-financing operations are reported in accordance with the equity method. Internal receivables and liabilities related to the sales-financing operations are excluded.
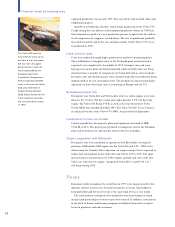
Change in net financial assets
SEK billion
Cash flow from operations 16.6
Capital expenditures (9.8)
Investments in leasing assets (0.5)
Disposals 1.0
Acquired companies (2.3)
Dividend (2.0)
Other including changes
in exchange rates (0.8)
Change after normal dividend 2.2
Sale of shares, net 10.7
Redemption of shares (5.8)
Total change 7.1
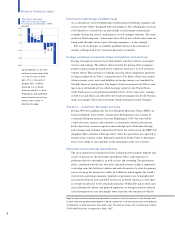
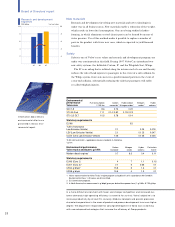
Cash flow from operations,
excluding sales financing
SEK billion
20
10
5
095 96 97
15