Volvo 1997 Annual Report Download - page 16
Download and view the complete annual report
Please find page 16 of the 1997 Volvo annual report below. You can navigate through the pages in the report by either clicking on the pages listed below, or by using the keyword search tool below to find specific information within the annual report.-
 1
1 -
2
-
3
-
4
-
5
-
 6
6 -
 7
7 -
 8
8 -
 9
9 -
 10
10 -
 11
11 -
 12
12 -
 13
13 -
 14
14 -
 15
15 -
 16
16 -
 17
17 -
 18
18 -
 19
19 -
 20
20 -
 21
21 -
 22
22 -
 23
23 -
 24
24 -
 25
25 -
 26
26 -
27
-
28
-
29
-
30
-
31
-
32
-
33
-
34
-
35
-
36
-
37
-
38
-
39
-
40
-
41
-
42
-
43
-
44
-
45
-
46
-
47
-
48
-
49
-
50
-
51
-
52
-
53
-
54
-
55
-
56
-
57
-
58
-
59
-
60
-
61
-
62
-
63
-
64
-
65
-
66
-
67
-
68
-
69
-
70
-
71
-
72
-
73
-
74
-
75
-
76
-
77
-
78
-
79
-
80
-
81
-
82
-
83
-
84
-
85
-
86
-
87
-
88
-
89
-
90
-
91
-
92
-
93
 |
 |

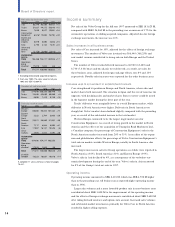
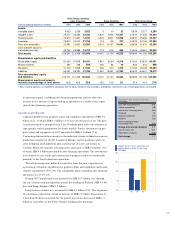
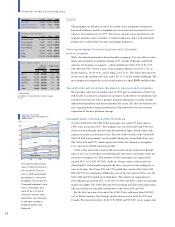
Sales by m arket area
SEK M 1995 1996 1997 %
Western
Europe 86,056 90,322 101,444 +11
Eastern
Europe 2,222 2,794 3,939 +39
North
America 39,011 36,560 51,052 +38
South
America 7,117 4,844 6,983 +41
Asia 17,097 16,151 15,545 (4)
Other
markets 2,993 3,546 4,596 +28
Automotive
opera-
tions 154,496 154,217 183,559
Operations
being
divested 17,015 1,843 66
Total 171,511 156,060 183,625 +18
of which
Sweden 16,223 16,631 19,816 +14
Num ber of vehicles sold
1995 1996 1997 %
Cars 374,640 368,250 386,440 +5
Trucks 76,490 63,680 68,980 +8
Buses 6,830 7,410 8,730 +18
Net sales by business area
SEK M 1995 1996 1997 % 1
Cars 83,340 83,589 96,453 +15
Trucks 51,027 44,275 50,840 +15
Buses 7,695 8,527 10,582 +24
Construction
Equipment 6,916 212,804 16,758 +20
Marine and
industrial
engines 3,878 3,885 4,466 +15
Aero 3,790 4,143 7,476 +24
Other and
elimina-
tions (2,150) (3,006) (3,016) —
Automotive
opera-
tions 154,496 154,217 183,559 +17
Operations
being
divested 17,015 1,843 66 —
Total 171,511 156,060 183,625 —
14
Board of Directors’ report
14
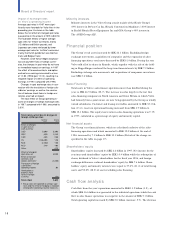
Income sum mary
Net sales of the Volvo Group for the full year 1997 amounted to SEK 183,625 M,
compared with SEK 156,060 M in the preceding year, an increase of 17% for the
automotive operations, excluding acquired companies. Adjusted also for foreign
exchange movements, the increase was 10%.
Sales increases in all business areas
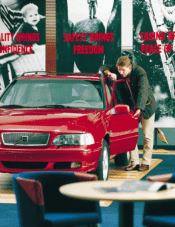
Net sales of Cars increased by 10%, adjusted for the effects of foreign exchange
movements. The number of Volvo cars invoiced was 386,440 (368,250) and
new model versions contributed to strong sales in both Europe and the United
States.
The number of Volvo trucks delivered increased to 68,980 (63,680) and
8,730 (7,410) buses and bus chassis were delivered; as a result, net sales for
these business areas, adjusted for foreign exchange effects, rose 8% and 14%
respectively. Notable sales increases were reported for the other business areas.
Increase was m ost evident in established m arkets
Cars strengthened its position in Europe and North America, where sales and
market shares both increased. The situation in Japan and the rest of Asia was the
opposite, with declining sales and market shares. Some recovery could be noted
in the Japanese market during the latter part of the year.
Trucks’ deliveries were marginally lower in a weak European market, while
deliveries in North America were higher. Deliveries in South America rose
sharply but Volvo’s market share declined slightly, compared with the preceding
year, as a result of the substantial increase in the total market.
Western Europe continued to be the largest single market area for
Construction Equipment. As a result of strong growth in the market in North
America and the effects of the acquisition of Champion Road Machinery Ltd.,
a Canadian company, the percentage of Construction Equipment’s sales in the
North American market increased from 26% to 35%. As an effect of the expan-
sion and globalization efforts, the percentage of Volvo Construction Equipment’s
total sales in markets outside Western Europe, notably in South America, also
increased.
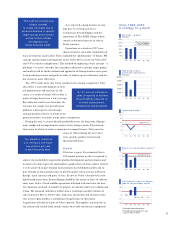
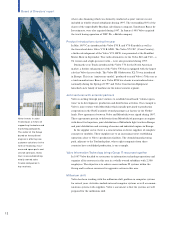
The largest increases in sales for Group operations as a whole were reported in
North America (38%), South America (41%) and Eastern Europe (39%).
Volvo’s sales in Asia declined by 4%, as a consequence of the turbulent eco-
nomic development during the end of the year. Volvo’s sales in Asia accounted
for 8% of the Group’s total net sales in 1997.
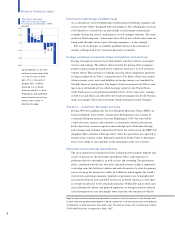
Operating incom e
Operating income amounted to SEK 8,418 M, which was SEK 4,708 M higher
than in the preceding year. All business areas reported higher operating income
than in 1996.
Larger sales volumes and a more favorable product mix in most business areas
contributed about SEK 3,000 M to the improvement of the operating income
and the effects of foreign exchange movements contributed about SEK 2,600 M
after taking forward contracts and options into account. Increased sales volumes
and substantial market investments, primarily for Volvo Cars in North America
resulted in higher selling expenses.
1 Excluding divested and acquired companies.
2 From July 1995. The sales value for full-year
1995 was SEK 13,684 M.
A complete 11-year summary is shown on pages
76–87.