Volvo 1997 Annual Report Download - page 81
Download and view the complete annual report
Please find page 81 of the 1997 Volvo annual report below. You can navigate through the pages in the report by either clicking on the pages listed below, or by using the keyword search tool below to find specific information within the annual report.-
 1
1 -
2
-
3
-
4
-
5
-
6
-
7
-
8
-
9
-
10
-
11
-
12
-
13
-
14
-
15
-
16
-
17
-
18
-
19
-
20
-
21
-
22
-
23
-
24
-
25
-
26
-
27
-
28
-
29
-
30
-
31
-
32
-
33
-
34
-
35
-
36
-
37
-
38
-
39
-
40
-
41
-
42
-
43
-
44
-
45
-
46
-
47
-
48
-
49
-
50
-
51
-
52
-
53
-
54
-
55
-
56
-
57
-
58
-
59
-
60
-
61
-
62
-
63
-
64
-
65
-
66
-
67
-
68
-
69
-
70
-
 71
71 -
 72
72 -
 73
73 -
 74
74 -
 75
75 -
 76
76 -
 77
77 -
 78
78 -
 79
79 -
 80
80 -
 81
81 -
 82
82 -
 83
83 -
 84
84 -
 85
85 -
 86
86 -
 87
87 -
 88
88 -
 89
89 -
 90
90 -
 91
91 -
92
-
93
 |
 |

79
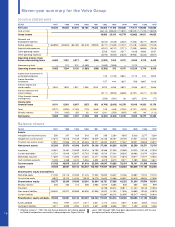
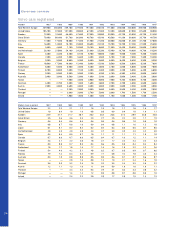
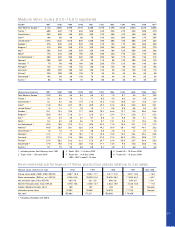
Net sales
SEK M 1987 1988 1989 1990 1991 1992 1993 1994 1995 1996 1997
Cars Western Europe 21,641 27,741 31,354 40,546 47,043 49,066 57,443
Eastern Europe — 391 719 572 746 888 1,238
North America 10,860 11,224 17,360 20,613 21,553 21,228 26,024
South America 121 88 288 468 847 482 672
Asia 4,053 4,277 8,150 10,365 11,974 10,868 9,618
Other markets 347 877 287 1,034 1,177 1,057 1,458
Total 38,523 38,392 41,356 39,569 37,022 44,598 58,158 73,598 83,340 83,589 96,453
Trucks Western Europe 16,718 15,252 15,851 22,718 27,613 27,014 28,087
Eastern Europe 528 518 599 948 1,299 1,721 2,274
North America 5,714 6,933 11,817 13,951 13,075 8,564 12,610
South America 1,606 484 3,188 4,780 4,641 2,912 3,904
Asia 3,066 1,675 2,170 2,474 2,863 2,577 2,410
Other markets 435 1,130 330 1,379 1,536 1,487 1,555
Total 17,938 26,025 28,999 27,492 28,067 25,992 33,955 46,250 51,027 44,275 50,840
Buses Western Europe 2,600 2,581 3,380 3,838 4,709 4,660 5,082
Eastern Europe 12 3 62 102 34 80 190
North America 2 1 43 34 736 1,575 2,314
South America 522 728 897 1,005 1,087 853 1,002
Asia 514 572 986 868 844 1,112 1,562
Other markets 170 566 119 289 285 247 432
Total 2,006 3,384 3,682 3,927 3,820 4,451 5,487 6,136 7,695 8,527 10,582
Construction Western Europe 4,199 7,163 7,836
Equipment1Eastern Europe 112 93 263
North America 1,403 3,385 5,785
South America 556 598 991
Asia 339 937 1,036
Other markets 307 628 847
Total 6,916 12,804 16,758
Marine and Western Europe 1,563 1,478 1,541 1,753 2,065 2,048 2,219
industrial Eastern Europe 0 0 0 0 1 2 34
engines North America 437 483 859 1,326 1,139 1,142 1,332
South America 159 92 74 92 99 109 136
Asia 406 407 434 464 458 486 643
Other markets 20 82 78 107 116 98 102
Total 2,361 2,593 2,735 2,927 2,585 2,542 2,986 3,742 3,878 3,885 4,466
Aero Western Europe 2,473 2,146 2,281 2,400 2,590 2,950 3,682
Eastern Europe 4 0 0 13 27 8 6
North America 1,208 1,244 1,326 1,104 1,100 1,071 3,066
South America 0 13 4 0 4 4 257
Asia 11 6 5 66 66 89 264
Other markets 4 9 11 5 3 21 201
Total 1,990 2,495 2,635 2,591 3,700 3,418 3,627 3,588 3,790 4,143 7,476
Other and eliminations 4,562 2,131 2,267 2,157 2,029 2,001 2,986 614 (2,150) (3,006) (3,016
Automotive operations 67,380 75,020 81,674 78,663 77,223 83,002 107,199 133,928 154,496 154,217 183,559
Operations being divested, etc 25,140 21,619 9,298 4,522 – – 3,956 21,938 17,015 1,843 66
Group total 92,520 96,639 90,972 83,185 77,223 83,002 111,155 155,866 171,511 156,060 183,625
1. Subsidiary in the Volvo Group as from July 1995. Net sales for the Con-
struction Equipment business area in the years 1991 through 1995,
calculated using the average exchange rate for the U.S. dollar in each
year, amounted to SEK 8,273 M, SEK 7,890 M, SEK 9,665 M, SEK
12,084 M and SEK 13,684 M, respectively.
Effective in 1997, the Volvo Group’s accounting per market area reflects
new geographical definitions, based on an ISO-standard. The figures for
1991–1996 has been adjusted to conform with the new principle.
)